PARK_BRASILIA


Location

lon / lat [deg]: -47.9167 / -15.7433

Source network: AERONET


Geostationary surface albedo (GSA) data


“+000”


“+057/+063”


Landcover information (based on ESA CCI landcover data)


Landcover fractions @ 2km distance


Landcover fractions @ 20 km distance


Legend


Distance to open water bodies [km]:

2.74

Distance to urban areas [km]:

0.75


Radius: 1 km

Number of landcover classes:

5

Dominant landcover type:

120: Shrubland

Fraction of dominant landcover type [%]:

44.0


Radius: 2 km

Number of landcover classes:

5

Dominant landcover type:

190: urban areas

Fraction of dominant landcover type [%]:

39.0


Radius: 5 km

Number of landcover classes:

7

Dominant landcover type:

190: urban areas

Fraction of dominant landcover type [%]:

49.0


Radius: 10 km

Number of landcover classes:

7

Dominant landcover type:

190: urban areas

Fraction of dominant landcover type [%]:

42.0


Radius: 20 km

Number of landcover classes:

7

Dominant landcover type:

190: urban areas

Fraction of dominant landcover type [%]:

34.0


Disturbances


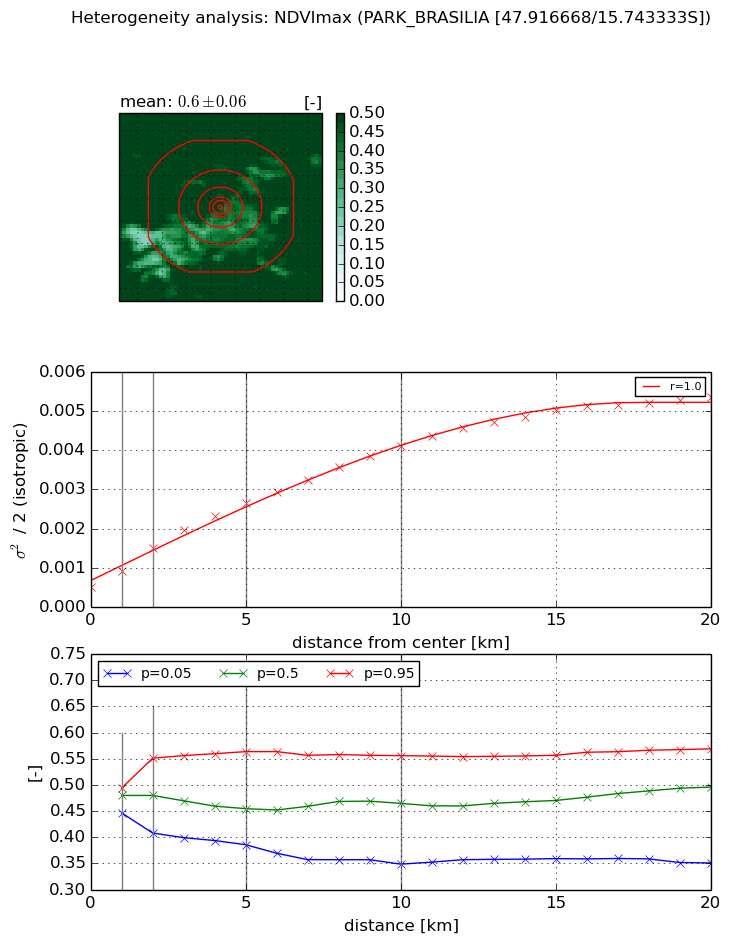
Heterogeneity analysis

The heterogeneity analysis provides information about the spatial and temporal heterogeneity of the site.

Topography


Roman et al. (2009) index


St

5.97024054837

Rcv

0.115740096497

Rse

0.0

Rst

-4.2984613917e-07

Rsv

-0.386751789619


Height range @ 1km [m]

59

Height range @ 2km [m]

104

Height range @ 5km [m]

134

Height range @ 10km [m]

-999

Height range @ 20km [m]

-999


Variance slope @ 1 km

244

Variance slope @ 2 km

300

Variance slope @ 5 km

367

Variance slope @ 10 km

-999

Variance slope @ 20 km

-999


NDVI (max. NDVI composite)


Roman et al. (2009) index


St

1.71351387332

Rcv

0.199512093176

Rse

0.0

Rst

-0.0657050656204

Rsv

1.4855711171


NDVI range @ 1km [-]

0.05

NDVI range @ 2km [-]

0.14

NDVI range @ 5km [-]

0.18

NDVI range @ 10km [-]

0.21

NDVI range @ 20km [-]

0.22


Variance slope @ 1 km

0.000406530188194

Variance slope @ 2 km

0.000504746257527

Variance slope @ 5 km

0.00043985570049

Variance slope @ 10 km

0.00035543031215

Variance slope @ 20 km

0.000237743634904


NDVI (min. NDVI composite)I


Roman et al. (2009) index


St

1.67157095804

Rcv

0.0831022748275

Rse

0.0

Rst

-0.264864642024

Rsv

1.44675198848


NDVI range @ 1km [-]

0.05

NDVI range @ 2km [-]

0.14

NDVI range @ 5km [-]

0.17

NDVI range @ 10km [-]

0.18

NDVI range @ 20km [-]

0.17


NDVI slope @ 1 km

0.000328331141598

NDVI slope @ 2 km

0.000398650850964

NDVI slope @ 5 km

0.000317126026537

NDVI slope @ 10 km

0.000215492308553

NDVI slope @ 20 km

0.000130893541403


Temporal stability analysis

+000 deg (BHR)


BHR statistics

Temporal stability [1/decade]:


abs

rel


Weighted least square:

-99999.0


Ordinary least square:

-99999.0


Probabilities that GCOS criteria is met:

Weighted least square:

-99999.0 %

Ordinary least square:

-99999.0 %


DHR statistics

Temporal stability [1/decade]:


abs

rel


Weighted least square:

-99999.0


Ordinary least square:

-99999.0


Probabilities that GCOS criteria is met:

Weighted least square:

-99999.0 %

Ordinary least square:

-99999.0 %


+057/+063 deg (BHR)


BHR statistics

Temporal stability [1/decade]:


abs

rel


Weighted least square:

None


Ordinary least square:

None


Probabilities that GCOS criteria is met:

Weighted least square:

None %

Ordinary least square:

None %


DHR statistics

Temporal stability [1/decade]:


abs

rel


Weighted least square:

None


Ordinary least square:

None


Probabilities that GCOS criteria is met:

Weighted least square:

None %

Ordinary least square:

None %


Temporal anomaly analyis

The variance of the temporal anomalies provides an additional measure about the stability of the signal AFTER removal of the mean seasonal cylce.

+000 deg


+057/+063 deg