PAYERNE


Location

lon / lat [deg]: 6.944 / 46.815

Source network: ALBEDOVAL1


Geostationary surface albedo (GSA) data


“+000”


“+057/+063”


Landcover information (based on ESA CCI landcover data)


Landcover fractions @ 2km distance


Landcover fractions @ 20 km distance


Legend


Distance to open water bodies [km]:

8.22

Distance to urban areas [km]:

0.08


Radius: 1 km

Number of landcover classes:

2

Dominant landcover type:

190: urban areas

Fraction of dominant landcover type [%]:

71.0


Radius: 2 km

Number of landcover classes:

5

Dominant landcover type:

10: cropland, rainfed

Fraction of dominant landcover type [%]:

54.0


Radius: 5 km

Number of landcover classes:

6

Dominant landcover type:

10: cropland, rainfed

Fraction of dominant landcover type [%]:

73.0


Radius: 10 km

Number of landcover classes:

8

Dominant landcover type:

10: cropland, rainfed

Fraction of dominant landcover type [%]:

67.0


Radius: 20 km

Number of landcover classes:

9

Dominant landcover type:

10: cropland, rainfed

Fraction of dominant landcover type [%]:

44.0


Disturbances


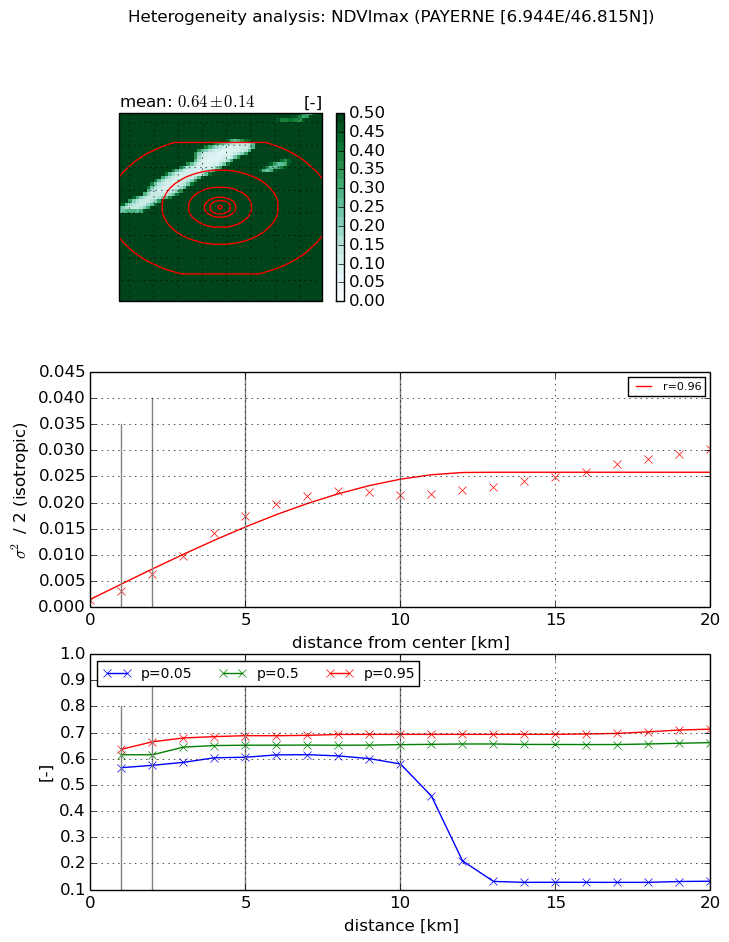
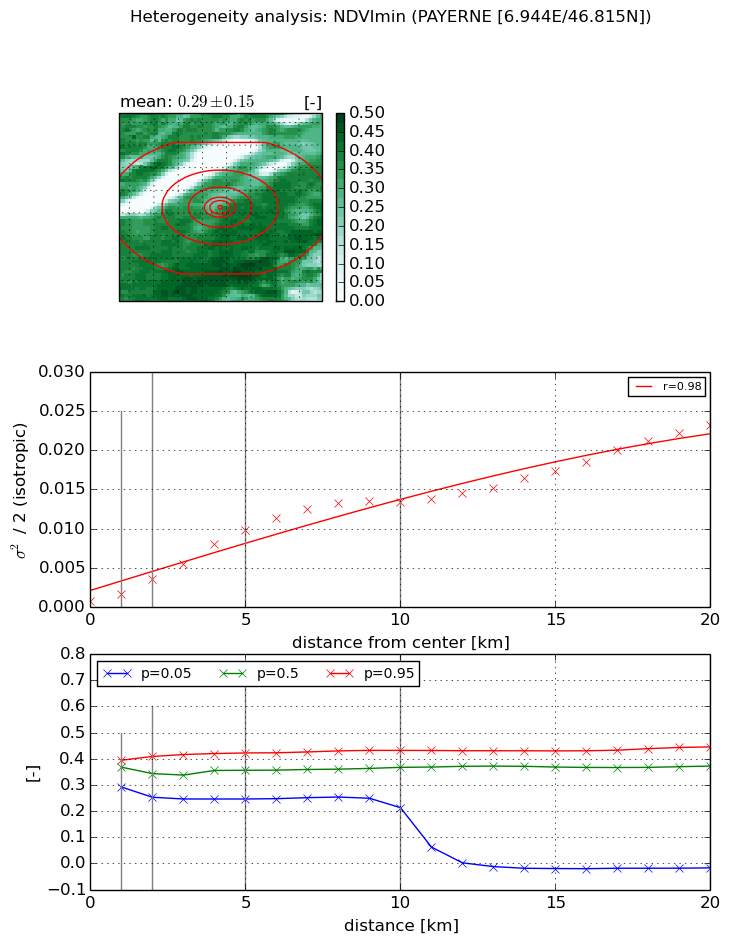
Heterogeneity analysis

The heterogeneity analysis provides information about the spatial and temporal heterogeneity of the site.

Topography


Roman et al. (2009) index


St

2.4081734012

Rcv

0.152477380763

Rse

0.0

Rst

-0.0932875984357

Rsv

-0.999992489308


Height range @ 1km [m]

54

Height range @ 2km [m]

121

Height range @ 5km [m]

200

Height range @ 10km [m]

-999

Height range @ 20km [m]

-999


Variance slope @ 1 km

718

Variance slope @ 2 km

902

Variance slope @ 5 km

1101

Variance slope @ 10 km

-999

Variance slope @ 20 km

-999


NDVI (max. NDVI composite)


Roman et al. (2009) index


St

0.931286074993

Rcv

-0.0875362921432

Rse

0.0

Rst

-0.417168577244

Rsv

2.71664685116


NDVI range @ 1km [-]

0.07

NDVI range @ 2km [-]

0.09

NDVI range @ 5km [-]

0.08

NDVI range @ 10km [-]

0.11

NDVI range @ 20km [-]

0.58


Variance slope @ 1 km

0.00166239534996

Variance slope @ 2 km

0.00247677258085

Variance slope @ 5 km

0.00334758846862

Variance slope @ 10 km

0.00229465876385

Variance slope @ 20 km

0.00124036627922


NDVI (min. NDVI composite)I


Roman et al. (2009) index


St

4.31692462055

Rcv

-0.0401612719409

Rse

0.0

Rst

-0.107376770464

Rsv

0.54740112464


NDVI range @ 1km [-]

0.1

NDVI range @ 2km [-]

0.16

NDVI range @ 5km [-]

0.18

NDVI range @ 10km [-]

0.22

NDVI range @ 20km [-]

0.46


NDVI slope @ 1 km

0.000942320826816

NDVI slope @ 2 km

0.00140309196935

NDVI slope @ 5 km

0.00189862429991

NDVI slope @ 10 km

0.00142882795875

NDVI slope @ 20 km

0.00101720713127


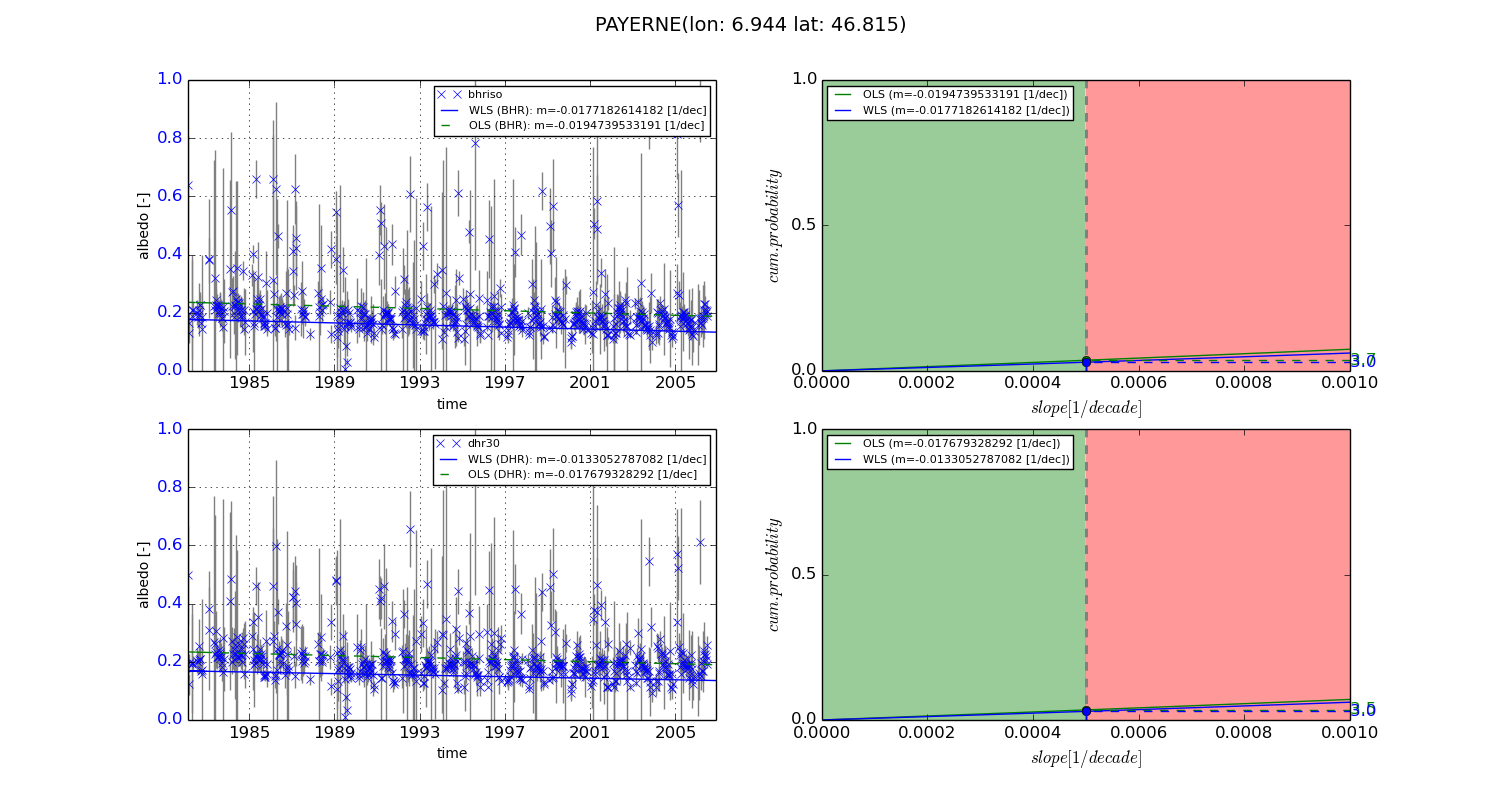
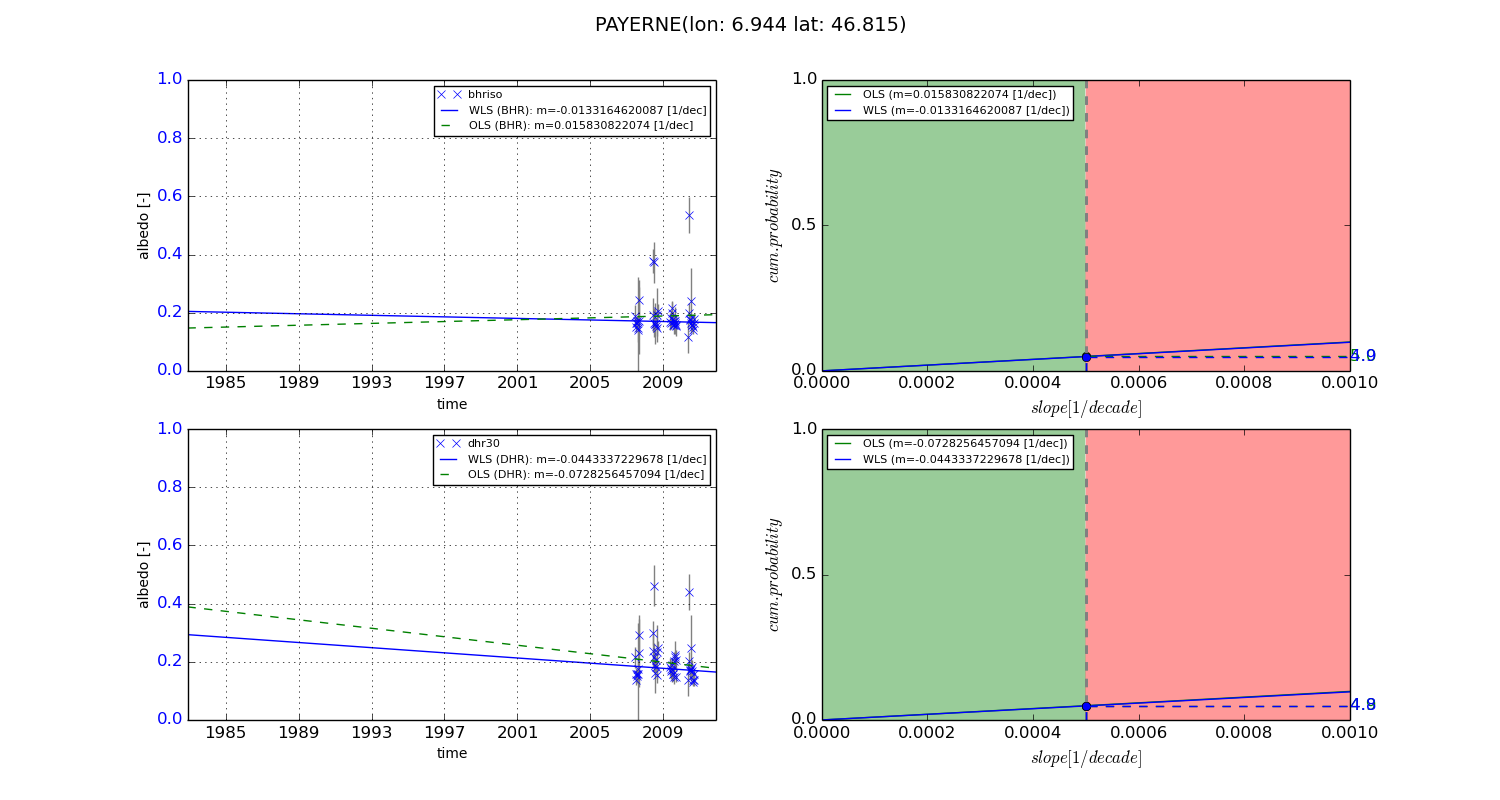
Temporal stability analysis

+000 deg (BHR)


BHR statistics

Temporal stability [1/decade]:


abs

rel


Weighted least square:

-0.0177182614182


Ordinary least square:

-0.0194739533191


Probabilities that GCOS criteria is met:

Weighted least square:

3.0 %

Ordinary least square:

3.7 %


DHR statistics

Temporal stability [1/decade]:


abs

rel


Weighted least square:

-0.0133052787082


Ordinary least square:

-0.017679328292


Probabilities that GCOS criteria is met:

Weighted least square:

3.0 %

Ordinary least square:

3.5 %


+057/+063 deg (BHR)


BHR statistics

Temporal stability [1/decade]:


abs

rel


Weighted least square:

-0.0133164620087


Ordinary least square:

0.015830822074


Probabilities that GCOS criteria is met:

Weighted least square:

4.9 %

Ordinary least square:

5.0 %


DHR statistics

Temporal stability [1/decade]:


abs

rel


Weighted least square:

-0.0443337229678


Ordinary least square:

-0.0728256457094


Probabilities that GCOS criteria is met:

Weighted least square:

4.8 %

Ordinary least square:

4.9 %


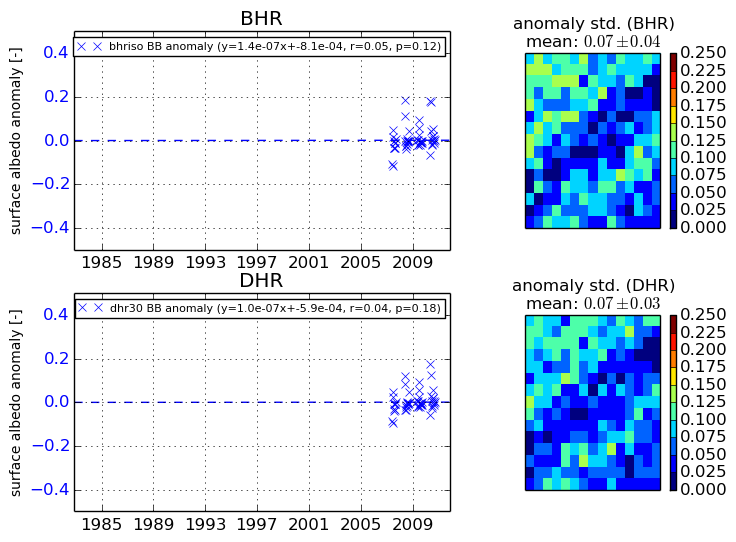
Temporal anomaly analyis

The variance of the temporal anomalies provides an additional measure about the stability of the signal AFTER removal of the mean seasonal cylce.
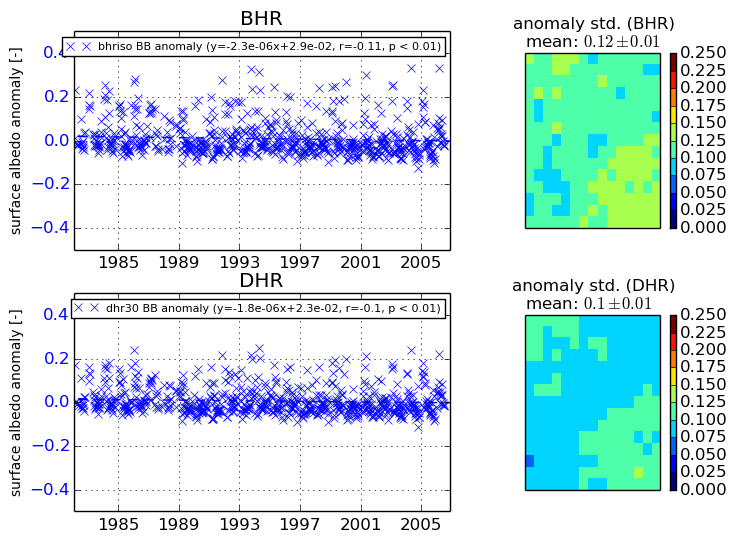
+000 deg


+057/+063 deg