PFAELZER_WALD


Location

lon / lat [deg]: 7.94 / 49.325

Source network: ALBEDOVAL2


Geostationary surface albedo (GSA) data


“+000”


“+057/+063”


Landcover information (based on ESA CCI landcover data)


Landcover fractions @ 2km distance


Landcover fractions @ 20 km distance


Legend


Distance to open water bodies [km]:

19.6

Distance to urban areas [km]:

1.42


Radius: 1 km

Number of landcover classes:

2

Dominant landcover type:

90: Tree cover, mixed leaf type

Fraction of dominant landcover type [%]:

80.0


Radius: 2 km

Number of landcover classes:

4

Dominant landcover type:

90: Tree cover, mixed leaf type

Fraction of dominant landcover type [%]:

70.0


Radius: 5 km

Number of landcover classes:

4

Dominant landcover type:

90: Tree cover, mixed leaf type

Fraction of dominant landcover type [%]:

65.0


Radius: 10 km

Number of landcover classes:

3

Dominant landcover type:

90: Tree cover, mixed leaf type

Fraction of dominant landcover type [%]:

55.0


Radius: 20 km

Number of landcover classes:

6

Dominant landcover type:

90: Tree cover, mixed leaf type

Fraction of dominant landcover type [%]:

41.0


Disturbances


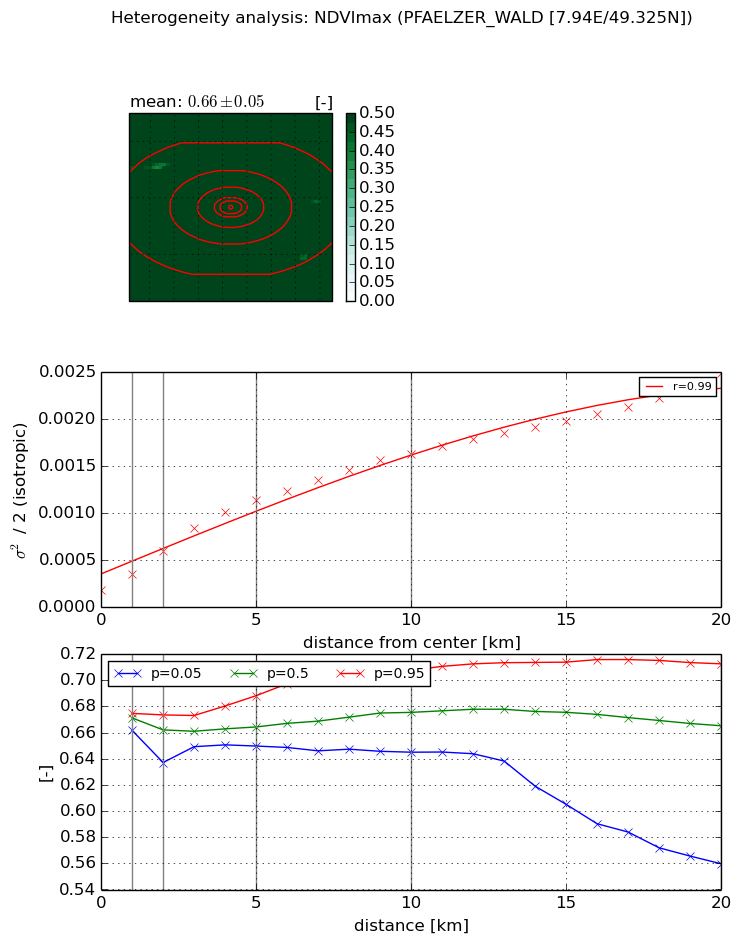
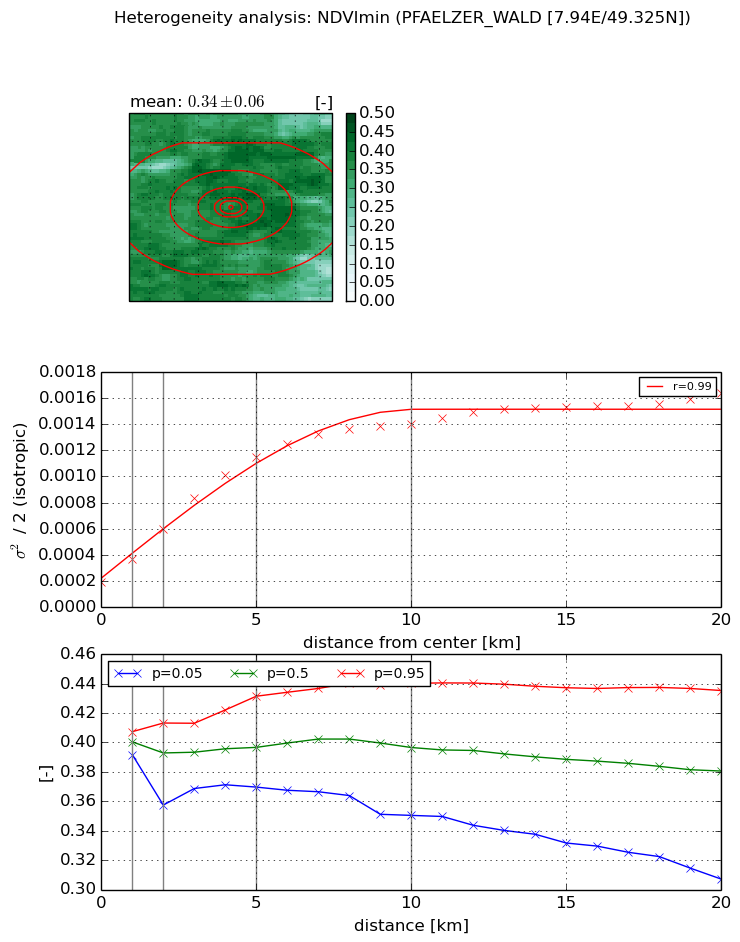
Heterogeneity analysis

The heterogeneity analysis provides information about the spatial and temporal heterogeneity of the site.

Topography


Roman et al. (2009) index


St

0.000124837240245

Rcv

0.190809385583

Rse

0.0

Rst

-0.26049665443

Rsv

24030.8393098


Height range @ 1km [m]

174

Height range @ 2km [m]

169

Height range @ 5km [m]

256

Height range @ 10km [m]

-999

Height range @ 20km [m]

-999


Variance slope @ 1 km

3225

Variance slope @ 2 km

1736

Variance slope @ 5 km

905

Variance slope @ 10 km

-999

Variance slope @ 20 km

-999


NDVI (max. NDVI composite)


Roman et al. (2009) index


St

nan

Rcv

nan

Rse

nan

Rst

nan

Rsv

nan


NDVI range @ 1km [-]

0.01

NDVI range @ 2km [-]

0.04

NDVI range @ 5km [-]

0.04

NDVI range @ 10km [-]

0.06

NDVI range @ 20km [-]

0.15


Variance slope @ 1 km

0.000176374219329

Variance slope @ 2 km

0.000208008949805

Variance slope @ 5 km

0.000199940402478

Variance slope @ 10 km

0.000144542059362

Variance slope @ 20 km

0.000101750745315


NDVI (min. NDVI composite)I


Roman et al. (2009) index


St

nan

Rcv

nan

Rse

nan

Rst

nan

Rsv

nan


NDVI range @ 1km [-]

0.02

NDVI range @ 2km [-]

0.06

NDVI range @ 5km [-]

0.06

NDVI range @ 10km [-]

0.09

NDVI range @ 20km [-]

0.13


NDVI slope @ 1 km

0.000176978544733

NDVI slope @ 2 km

0.000204933686333

NDVI slope @ 5 km

0.000197900269637

NDVI slope @ 10 km

0.000123791790843

NDVI slope @ 20 km

5.84556572547e-05


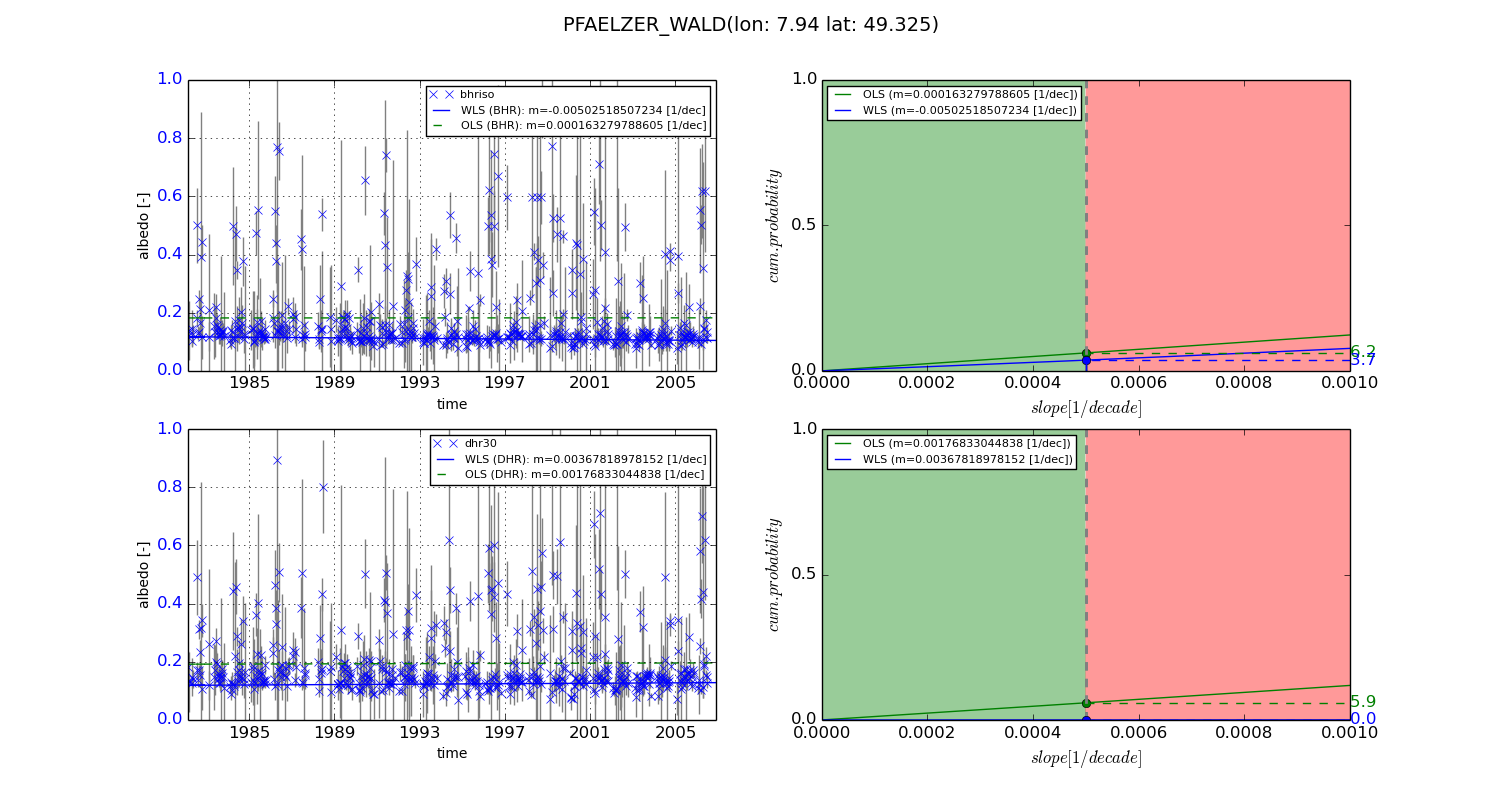
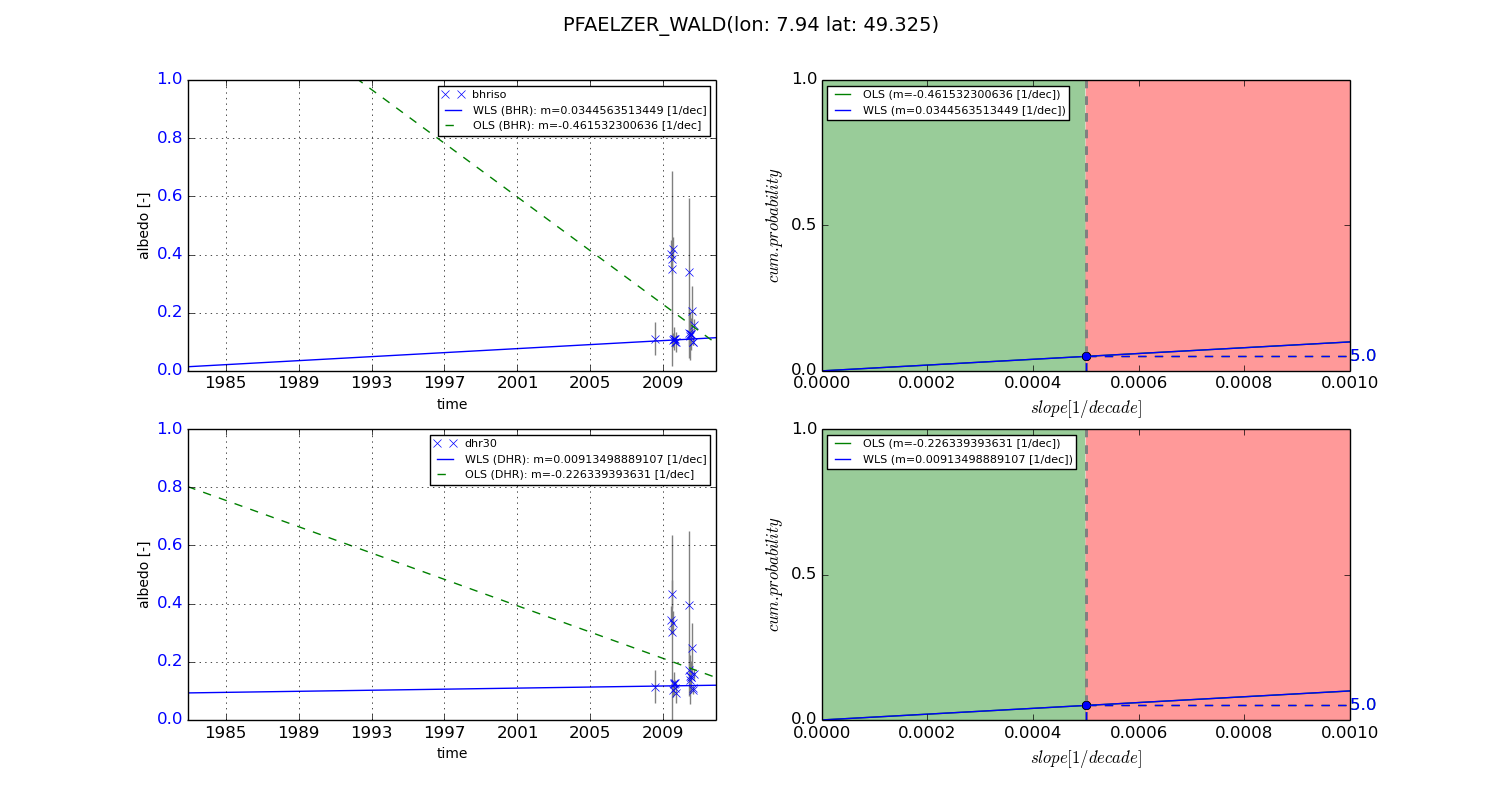
Temporal stability analysis

+000 deg (BHR)


BHR statistics

Temporal stability [1/decade]:


abs

rel


Weighted least square:

-0.00502518507234


Ordinary least square:

0.000163279788605


Probabilities that GCOS criteria is met:

Weighted least square:

3.7 %

Ordinary least square:

6.2 %


DHR statistics

Temporal stability [1/decade]:


abs

rel


Weighted least square:

0.00367818978152


Ordinary least square:

0.00176833044838


Probabilities that GCOS criteria is met:

Weighted least square:

0.0 %

Ordinary least square:

5.9 %


+057/+063 deg (BHR)


BHR statistics

Temporal stability [1/decade]:


abs

rel


Weighted least square:

0.0344563513449


Ordinary least square:

-0.461532300636


Probabilities that GCOS criteria is met:

Weighted least square:

5.0 %

Ordinary least square:

5.0 %


DHR statistics

Temporal stability [1/decade]:


abs

rel


Weighted least square:

0.00913498889107


Ordinary least square:

-0.226339393631


Probabilities that GCOS criteria is met:

Weighted least square:

5.0 %

Ordinary least square:

5.0 %


Temporal anomaly analyis

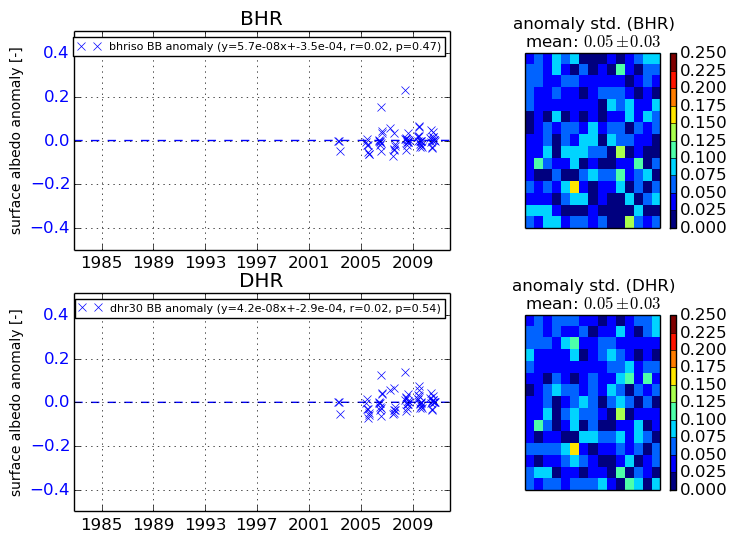
The variance of the temporal anomalies provides an additional measure about the stability of the signal AFTER removal of the mean seasonal cylce.
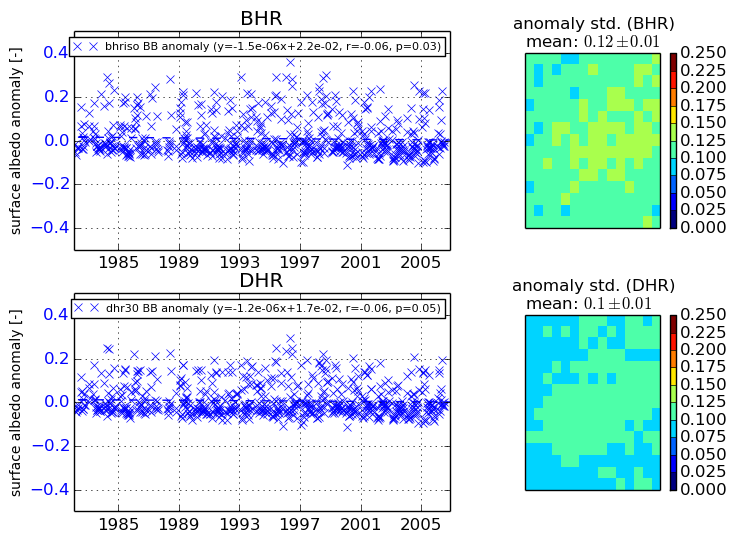
+000 deg


+057/+063 deg