PIC_DU_MIDI


Location

lon / lat [deg]: 0.1413 / 42.9372

Source network: AERONET


Geostationary surface albedo (GSA) data


“+000”


“+057/+063”


Landcover information (based on ESA CCI landcover data)


Landcover fractions @ 2km distance


Landcover fractions @ 20 km distance


Legend


Distance to open water bodies [km]:

4.44

Distance to urban areas [km]:

3.77


Radius: 1 km

Number of landcover classes:

4

Dominant landcover type:

10: cropland, rainfed

Fraction of dominant landcover type [%]:

66.0


Radius: 2 km

Number of landcover classes:

7

Dominant landcover type:

10: cropland, rainfed

Fraction of dominant landcover type [%]:

42.0


Radius: 5 km

Number of landcover classes:

8

Dominant landcover type:

130: grassland

Fraction of dominant landcover type [%]:

36.0


Radius: 10 km

Number of landcover classes:

9

Dominant landcover type:

130: grassland

Fraction of dominant landcover type [%]:

23.0


Radius: 20 km

Number of landcover classes:

9

Dominant landcover type:

60: Tree cover, broadleaved, decidous

Fraction of dominant landcover type [%]:

38.0


Disturbances


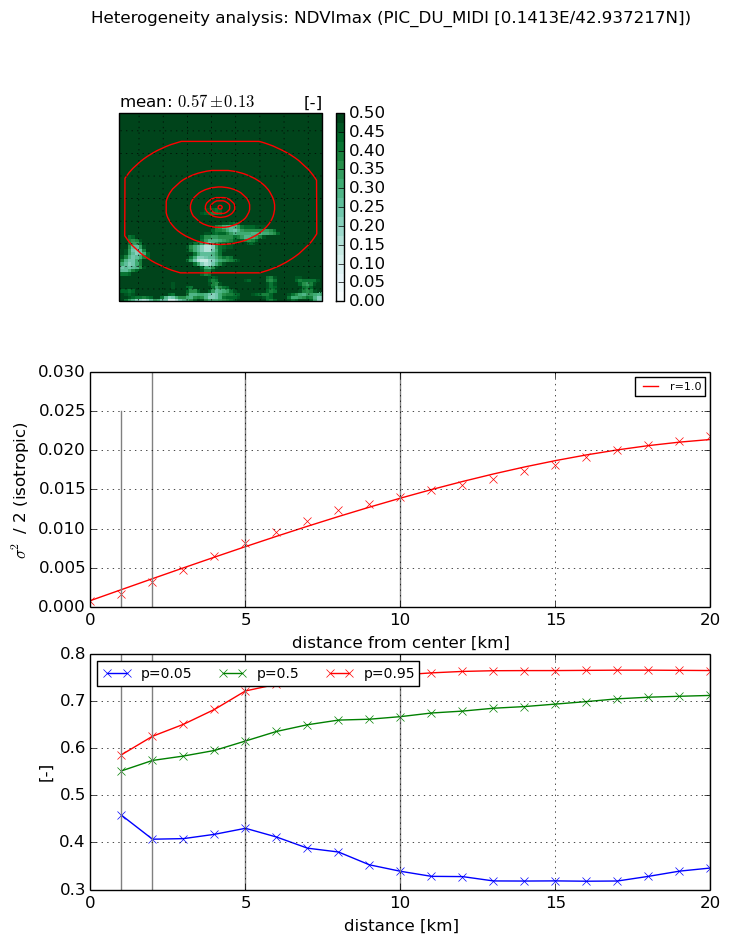
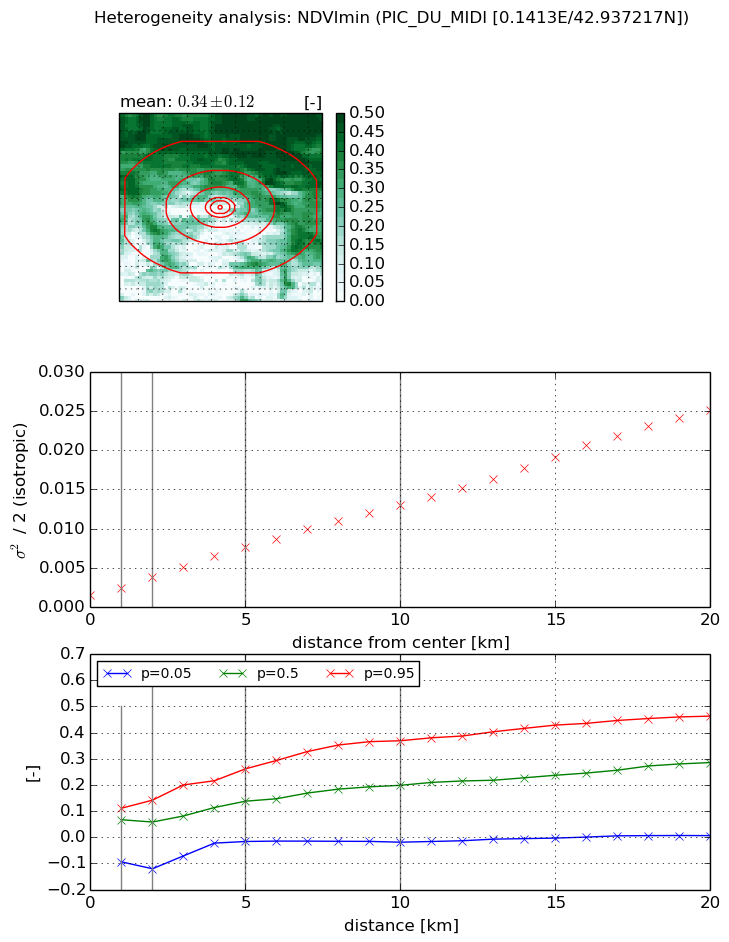
Heterogeneity analysis

The heterogeneity analysis provides information about the spatial and temporal heterogeneity of the site.

Topography


Roman et al. (2009) index


St

2.41426865167

Rcv

0.344127214293

Rse

0.0

Rst

-0.0537909658951

Rsv

0.844694152089


Height range @ 1km [m]

607

Height range @ 2km [m]

826

Height range @ 5km [m]

1041

Height range @ 10km [m]

-999

Height range @ 20km [m]

-999


Variance slope @ 1 km

35885

Variance slope @ 2 km

39026

Variance slope @ 5 km

31594

Variance slope @ 10 km

-999

Variance slope @ 20 km

-999


NDVI (max. NDVI composite)


Roman et al. (2009) index


St

2.77767633169

Rcv

0.00948617661924

Rse

0.0

Rst

-0.256209841022

Rsv

0.814343426038


NDVI range @ 1km [-]

0.13

NDVI range @ 2km [-]

0.22

NDVI range @ 5km [-]

0.29

NDVI range @ 10km [-]

0.42

NDVI range @ 20km [-]

0.42


Variance slope @ 1 km

0.000909028747986

Variance slope @ 2 km

0.00122004076843

Variance slope @ 5 km

0.0015309677468

Variance slope @ 10 km

0.00141157623739

Variance slope @ 20 km

0.00105872870381


NDVI (min. NDVI composite)I


Roman et al. (2009) index


St

1.53257689826

Rcv

-0.283214309249

Rse

0.0

Rst

-0.674275730016

Rsv

-0.99999738169


NDVI range @ 1km [-]

0.21

NDVI range @ 2km [-]

0.26

NDVI range @ 5km [-]

0.28

NDVI range @ 10km [-]

0.39

NDVI range @ 20km [-]

0.46


NDVI slope @ 1 km

0.000908704646751

NDVI slope @ 2 km

0.00113430346762

NDVI slope @ 5 km

0.00125287832762

NDVI slope @ 10 km

0.0011627170654

NDVI slope @ 20 km

0.00118082148673


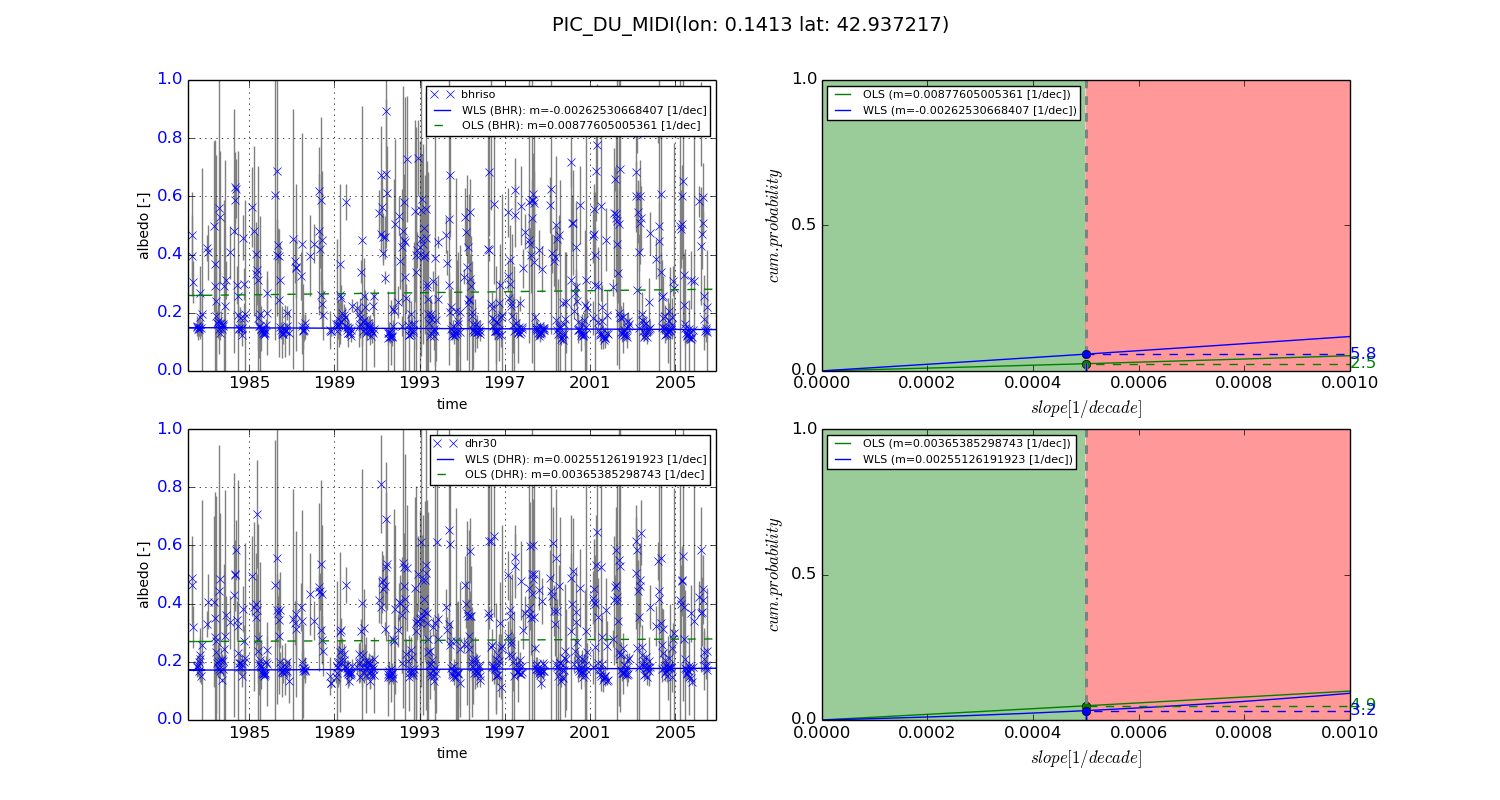
Temporal stability analysis

+000 deg (BHR)


BHR statistics

Temporal stability [1/decade]:


abs

rel


Weighted least square:

-0.00262530668407


Ordinary least square:

0.00877605005361


Probabilities that GCOS criteria is met:

Weighted least square:

5.8 %

Ordinary least square:

2.5 %


DHR statistics

Temporal stability [1/decade]:


abs

rel


Weighted least square:

0.00255126191923


Ordinary least square:

0.00365385298743


Probabilities that GCOS criteria is met:

Weighted least square:

3.2 %

Ordinary least square:

4.9 %


+057/+063 deg (BHR)


BHR statistics

Temporal stability [1/decade]:


abs

rel


Weighted least square:

-99999.0


Ordinary least square:

-99999.0


Probabilities that GCOS criteria is met:

Weighted least square:

-99999.0 %

Ordinary least square:

-99999.0 %


DHR statistics

Temporal stability [1/decade]:


abs

rel


Weighted least square:

-99999.0


Ordinary least square:

-99999.0


Probabilities that GCOS criteria is met:

Weighted least square:

-99999.0 %

Ordinary least square:

-99999.0 %


Temporal anomaly analyis

The variance of the temporal anomalies provides an additional measure about the stability of the signal AFTER removal of the mean seasonal cylce.
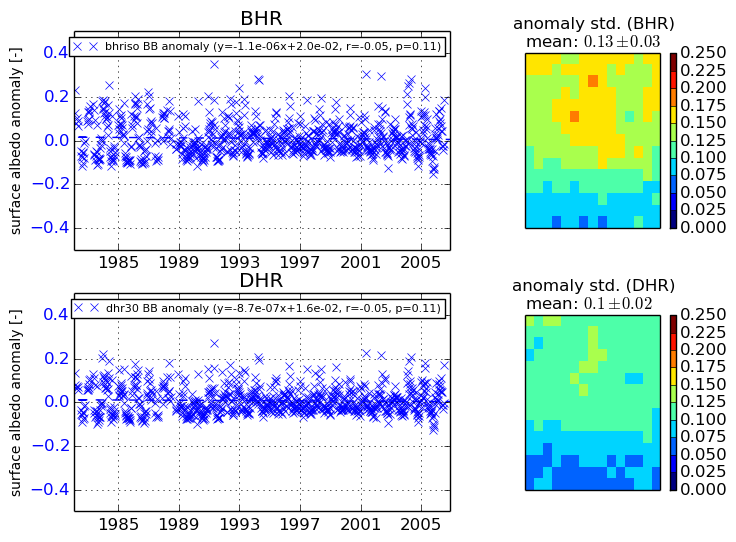
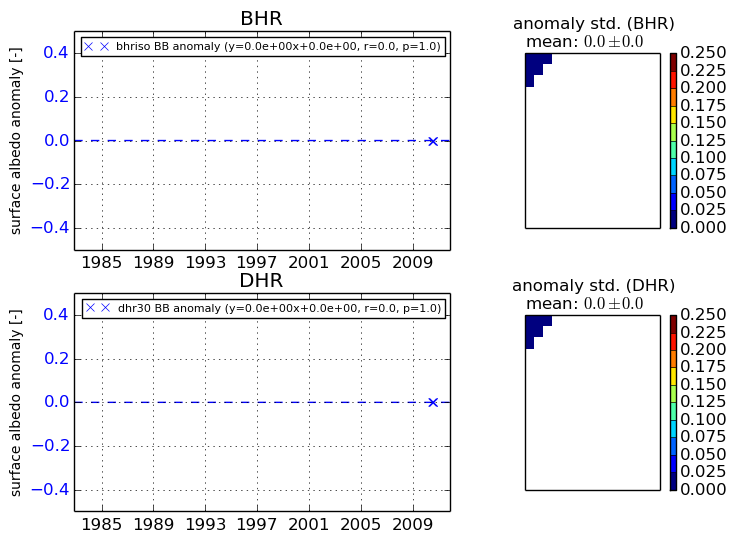
+000 deg


+057/+063 deg