POKHARA


Location

lon / lat [deg]: 83.9715 / 28.1508

Source network: AERONET


Geostationary surface albedo (GSA) data


“+000”


“+057/+063”


Landcover information (based on ESA CCI landcover data)


Landcover fractions @ 2km distance


Landcover fractions @ 20 km distance


Legend


Distance to open water bodies [km]:

6.06

Distance to urban areas [km]:

4.6


Radius: 1 km

Number of landcover classes:

6

Dominant landcover type:

40: mosaic natural vegetation (tree, shrub, herbaceous cover) (>50%) / cropland (<50%)

Fraction of dominant landcover type [%]:

35.0


Radius: 2 km

Number of landcover classes:

8

Dominant landcover type:

40: mosaic natural vegetation (tree, shrub, herbaceous cover) (>50%) / cropland (<50%)

Fraction of dominant landcover type [%]:

26.0


Radius: 5 km

Number of landcover classes:

7

Dominant landcover type:

40: mosaic natural vegetation (tree, shrub, herbaceous cover) (>50%) / cropland (<50%)

Fraction of dominant landcover type [%]:

24.0


Radius: 10 km

Number of landcover classes:

9

Dominant landcover type:

40: mosaic natural vegetation (tree, shrub, herbaceous cover) (>50%) / cropland (<50%)

Fraction of dominant landcover type [%]:

26.0


Radius: 20 km

Number of landcover classes:

8

Dominant landcover type:

40: mosaic natural vegetation (tree, shrub, herbaceous cover) (>50%) / cropland (<50%)

Fraction of dominant landcover type [%]:

24.0


Disturbances


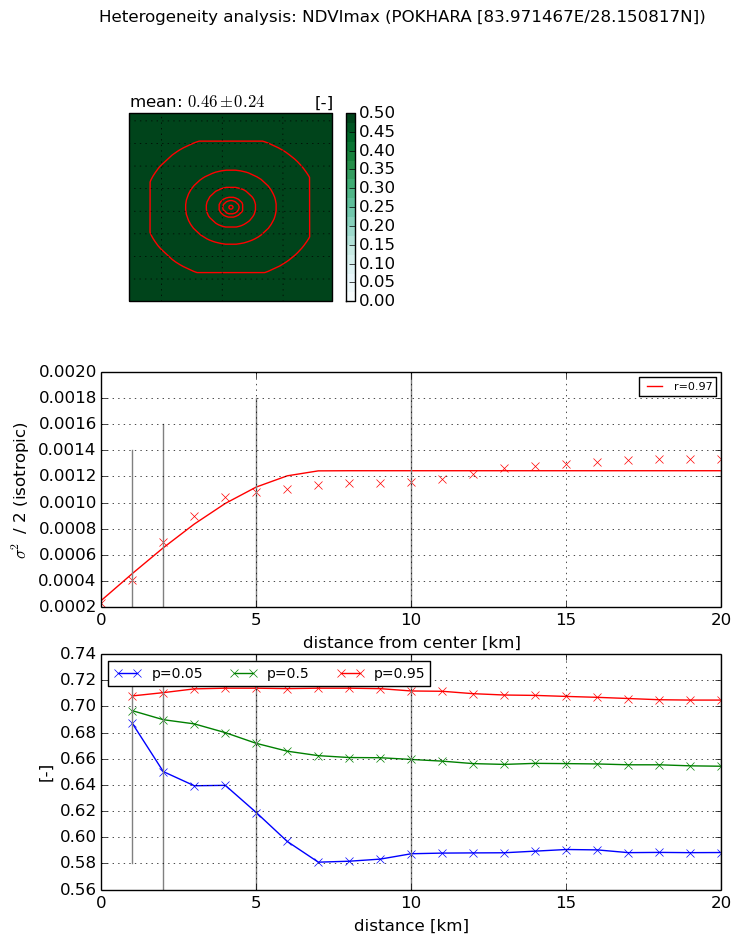
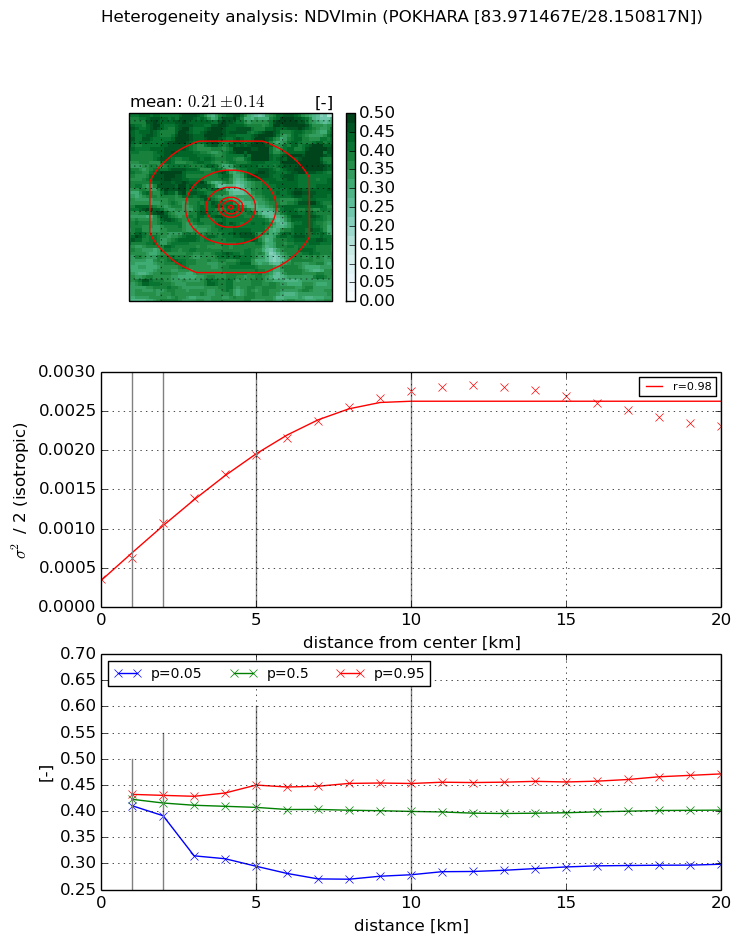
Heterogeneity analysis

The heterogeneity analysis provides information about the spatial and temporal heterogeneity of the site.

Topography


Roman et al. (2009) index


St

4.82350475661

Rcv

0.291749181138

Rse

0.0

Rst

-0.0334233236398

Rsv

0.296781893814


Height range @ 1km [m]

403

Height range @ 2km [m]

459

Height range @ 5km [m]

619

Height range @ 10km [m]

-999

Height range @ 20km [m]

-999


Variance slope @ 1 km

13258

Variance slope @ 2 km

13256

Variance slope @ 5 km

7705

Variance slope @ 10 km

-999

Variance slope @ 20 km

-999


NDVI (max. NDVI composite)


Roman et al. (2009) index


St

1.17725191266

Rcv

0.255560155946

Rse

0.0

Rst

-0.399108966707

Rsv

1.89363848063


NDVI range @ 1km [-]

0.02

NDVI range @ 2km [-]

0.06

NDVI range @ 5km [-]

0.1

NDVI range @ 10km [-]

0.12

NDVI range @ 20km [-]

0.12


Variance slope @ 1 km

0.000177008290617

Variance slope @ 2 km

0.000230807982284

Variance slope @ 5 km

0.000180875962897

Variance slope @ 10 km

8.59301866217e-05

Variance slope @ 20 km

4.06624398865e-05


NDVI (min. NDVI composite)I


Roman et al. (2009) index


St

2.52354344733

Rcv

0.365232037074

Rse

0.0

Rst

-8.03689558943e-07

Rsv

-0.823571736058


NDVI range @ 1km [-]

0.02

NDVI range @ 2km [-]

0.04

NDVI range @ 5km [-]

0.16

NDVI range @ 10km [-]

0.17

NDVI range @ 20km [-]

0.17


NDVI slope @ 1 km

0.000269256827095

NDVI slope @ 2 km

0.000357991243551

NDVI slope @ 5 km

0.000325946390717

NDVI slope @ 10 km

0.000244747456554

NDVI slope @ 20 km

8.71772507952e-05


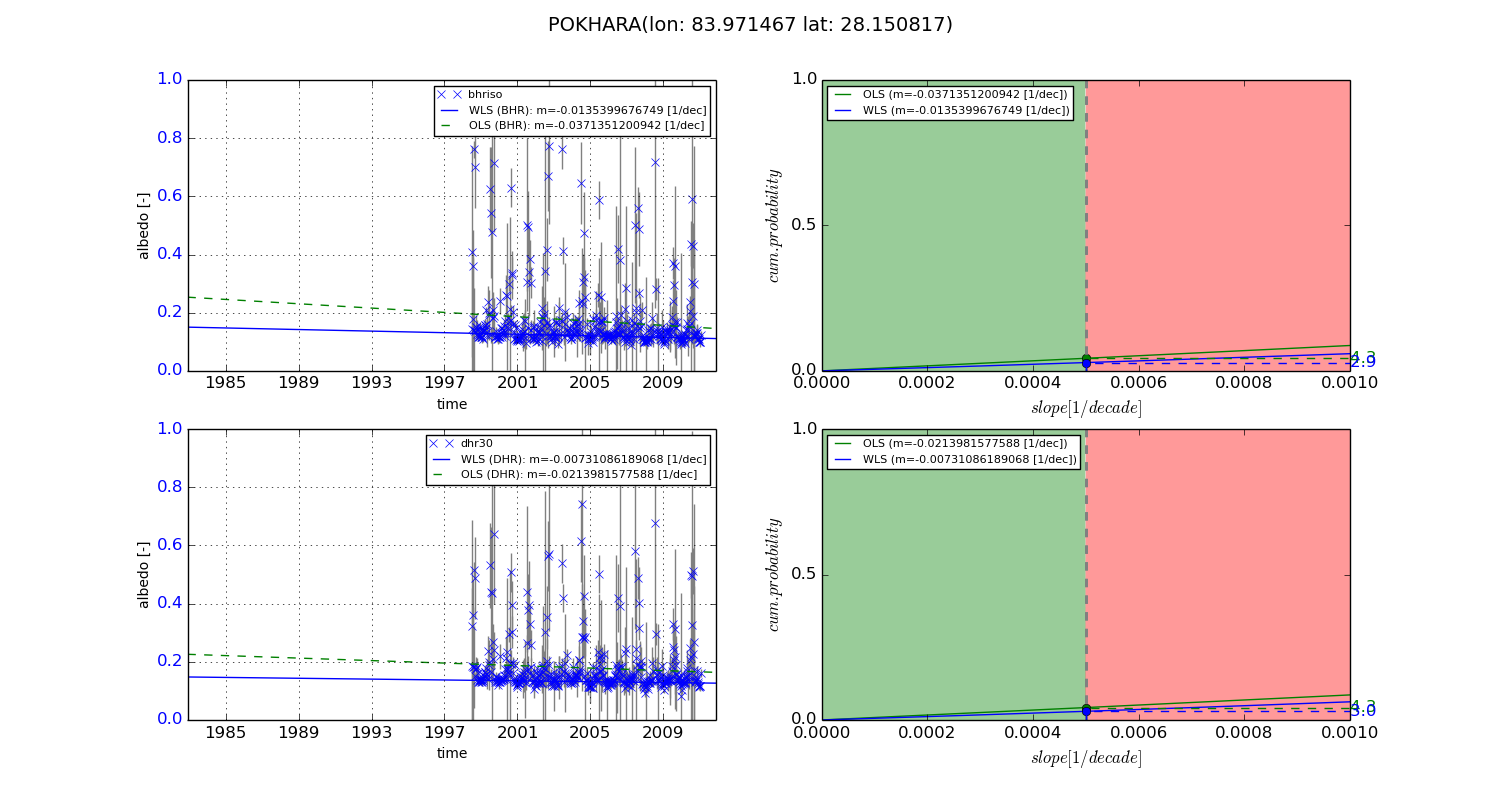
Temporal stability analysis

+000 deg (BHR)


BHR statistics

Temporal stability [1/decade]:


abs

rel


Weighted least square:

None


Ordinary least square:

None


Probabilities that GCOS criteria is met:

Weighted least square:

None %

Ordinary least square:

None %


DHR statistics

Temporal stability [1/decade]:


abs

rel


Weighted least square:

None


Ordinary least square:

None


Probabilities that GCOS criteria is met:

Weighted least square:

None %

Ordinary least square:

None %


+057/+063 deg (BHR)


BHR statistics

Temporal stability [1/decade]:


abs

rel


Weighted least square:

-0.0135399676749


Ordinary least square:

-0.0371351200942


Probabilities that GCOS criteria is met:

Weighted least square:

2.9 %

Ordinary least square:

4.3 %


DHR statistics

Temporal stability [1/decade]:


abs

rel


Weighted least square:

-0.00731086189068


Ordinary least square:

-0.0213981577588


Probabilities that GCOS criteria is met:

Weighted least square:

3.0 %

Ordinary least square:

4.3 %


Temporal anomaly analyis

The variance of the temporal anomalies provides an additional measure about the stability of the signal AFTER removal of the mean seasonal cylce.

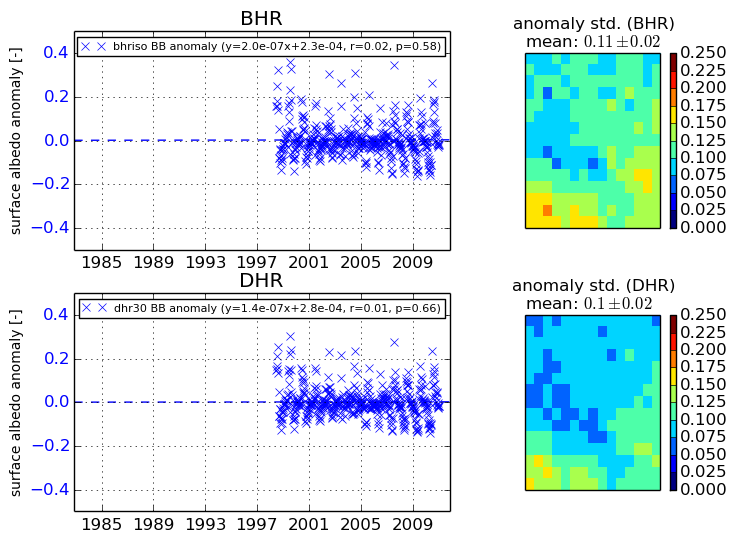
+000 deg


+057/+063 deg