PORTO_NACIONAL


Location

lon / lat [deg]: -48.0 / -11.0

Source network: AERONET


Geostationary surface albedo (GSA) data


“+000”


“+057/+063”


Landcover information (based on ESA CCI landcover data)


Landcover fractions @ 2km distance


Landcover fractions @ 20 km distance


Legend


Distance to open water bodies [km]:

26.31

Distance to urban areas [km]:

53.37


Radius: 1 km

Number of landcover classes:

4

Dominant landcover type:

120: Shrubland

Fraction of dominant landcover type [%]:

78.0


Radius: 2 km

Number of landcover classes:

7

Dominant landcover type:

120: Shrubland

Fraction of dominant landcover type [%]:

70.0


Radius: 5 km

Number of landcover classes:

8

Dominant landcover type:

120: Shrubland

Fraction of dominant landcover type [%]:

64.0


Radius: 10 km

Number of landcover classes:

8

Dominant landcover type:

120: Shrubland

Fraction of dominant landcover type [%]:

55.0


Radius: 20 km

Number of landcover classes:

8

Dominant landcover type:

120: Shrubland

Fraction of dominant landcover type [%]:

50.0


Disturbances


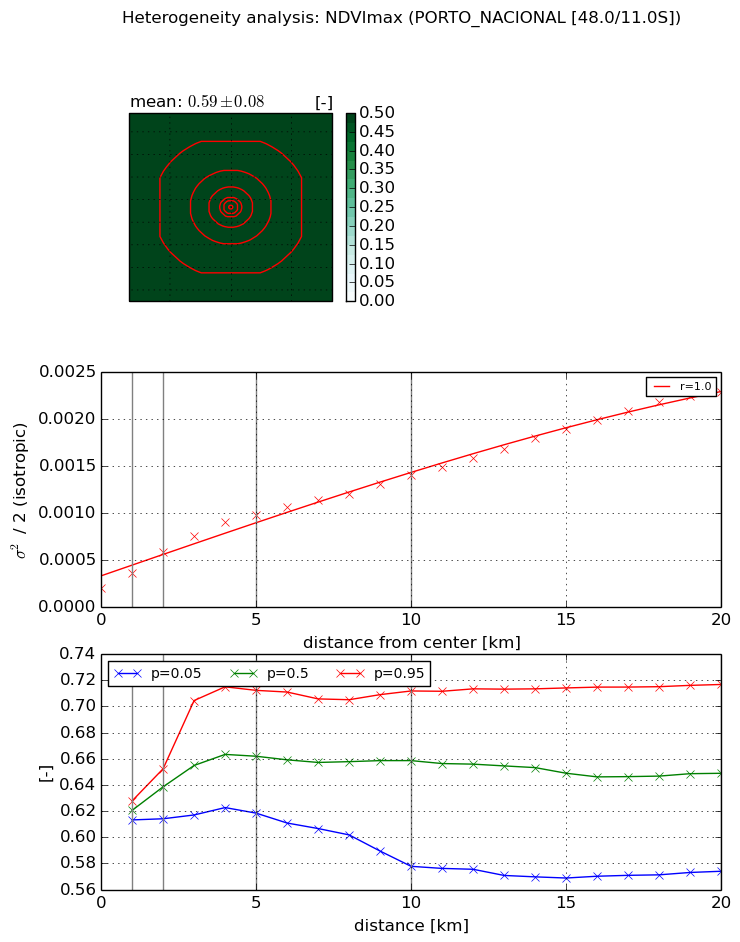
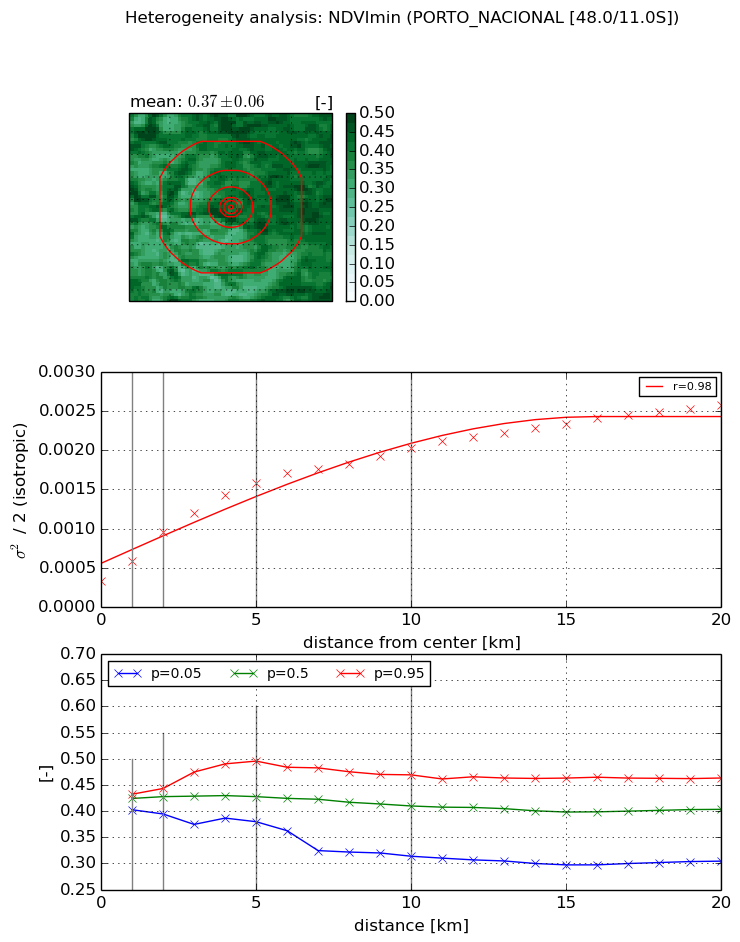
Heterogeneity analysis

The heterogeneity analysis provides information about the spatial and temporal heterogeneity of the site.

Topography


Roman et al. (2009) index


St

1.66640711025

Rcv

0.841258355369

Rse

0.0

Rst

-4.69183927707e-06

Rsv

-0.959017317383


Height range @ 1km [m]

18

Height range @ 2km [m]

41

Height range @ 5km [m]

75

Height range @ 10km [m]

-999

Height range @ 20km [m]

-999


Variance slope @ 1 km

510

Variance slope @ 2 km

346

Variance slope @ 5 km

164

Variance slope @ 10 km

-999

Variance slope @ 20 km

-999


NDVI (max. NDVI composite)


Roman et al. (2009) index


St

nan

Rcv

nan

Rse

nan

Rst

nan

Rsv

nan


NDVI range @ 1km [-]

0.01

NDVI range @ 2km [-]

0.04

NDVI range @ 5km [-]

0.09

NDVI range @ 10km [-]

0.13

NDVI range @ 20km [-]

0.14


Variance slope @ 1 km

0.000153793246607

Variance slope @ 2 km

0.000191215757371

Variance slope @ 5 km

0.000162853920449

Variance slope @ 10 km

0.000114410838729

Variance slope @ 20 km

9.92883535368e-05


NDVI (min. NDVI composite)I


Roman et al. (2009) index


St

1.2945238745e-07

Rcv

0.0768580910548

Rse

0.0

Rst

0.0800501601209

Rsv

23174543.4656


NDVI range @ 1km [-]

0.03

NDVI range @ 2km [-]

0.05

NDVI range @ 5km [-]

0.12

NDVI range @ 10km [-]

0.16

NDVI range @ 20km [-]

0.16


NDVI slope @ 1 km

0.000255765002943

NDVI slope @ 2 km

0.000311773554418

NDVI slope @ 5 km

0.000258416951658

NDVI slope @ 10 km

0.000162395203916

NDVI slope @ 20 km

9.733786181e-05


Temporal stability analysis

+000 deg (BHR)


BHR statistics

Temporal stability [1/decade]:


abs

rel


Weighted least square:

-99999.0


Ordinary least square:

-99999.0


Probabilities that GCOS criteria is met:

Weighted least square:

-99999.0 %

Ordinary least square:

-99999.0 %


DHR statistics

Temporal stability [1/decade]:


abs

rel


Weighted least square:

-99999.0


Ordinary least square:

-99999.0


Probabilities that GCOS criteria is met:

Weighted least square:

-99999.0 %

Ordinary least square:

-99999.0 %


+057/+063 deg (BHR)


BHR statistics

Temporal stability [1/decade]:


abs

rel


Weighted least square:

None


Ordinary least square:

None


Probabilities that GCOS criteria is met:

Weighted least square:

None %

Ordinary least square:

None %


DHR statistics

Temporal stability [1/decade]:


abs

rel


Weighted least square:

None


Ordinary least square:

None


Probabilities that GCOS criteria is met:

Weighted least square:

None %

Ordinary least square:

None %


Temporal anomaly analyis

The variance of the temporal anomalies provides an additional measure about the stability of the signal AFTER removal of the mean seasonal cylce.

+000 deg


+057/+063 deg