PORTO_VELHO_UNIR


Location

lon / lat [deg]: -63.94 / -8.8371

Source network: AERONET


Geostationary surface albedo (GSA) data


“+000”


“+057/+063”


Landcover information (based on ESA CCI landcover data)


Landcover fractions @ 2km distance


Landcover fractions @ 20 km distance


Legend


Distance to open water bodies [km]:

3.1

Distance to urban areas [km]:

1.03


Radius: 1 km

Number of landcover classes:

4

Dominant landcover type:

50: Tree cover, broadleaved, evergreen, closed to open (>15%)

Fraction of dominant landcover type [%]:

59.0


Radius: 2 km

Number of landcover classes:

6

Dominant landcover type:

30: mosaic cropland (>50%), natural veg. (< 50%)

Fraction of dominant landcover type [%]:

40.0


Radius: 5 km

Number of landcover classes:

8

Dominant landcover type:

30: mosaic cropland (>50%), natural veg. (< 50%)

Fraction of dominant landcover type [%]:

39.0


Radius: 10 km

Number of landcover classes:

10

Dominant landcover type:

30: mosaic cropland (>50%), natural veg. (< 50%)

Fraction of dominant landcover type [%]:

32.0


Radius: 20 km

Number of landcover classes:

10

Dominant landcover type:

50: Tree cover, broadleaved, evergreen, closed to open (>15%)

Fraction of dominant landcover type [%]:

37.0


Disturbances


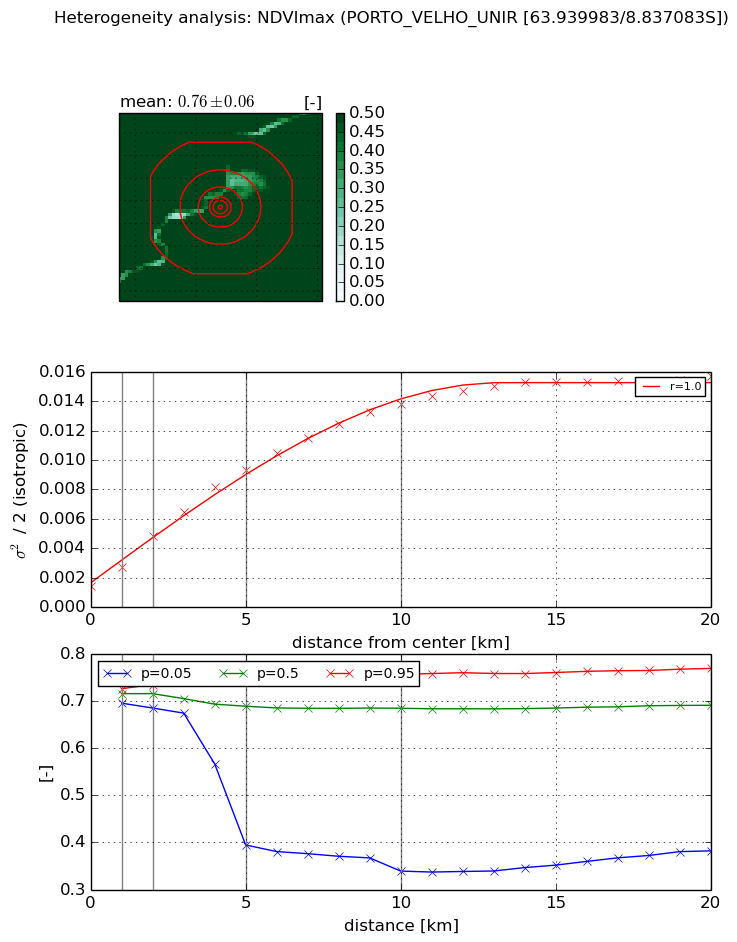
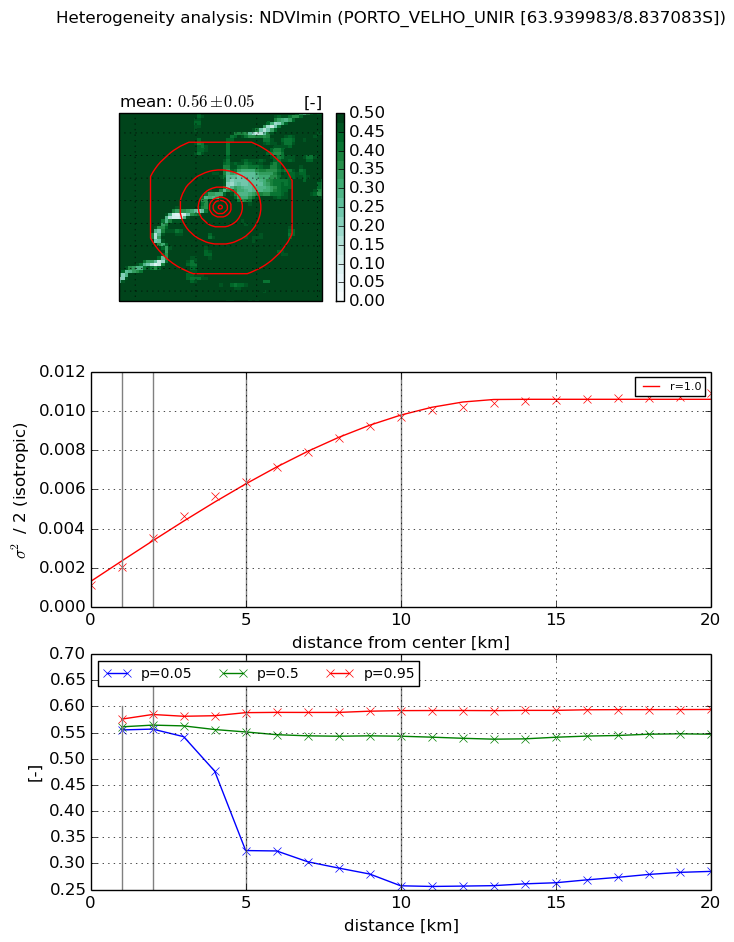
Heterogeneity analysis

The heterogeneity analysis provides information about the spatial and temporal heterogeneity of the site.

Topography


Roman et al. (2009) index


St

1.98658398686

Rcv

0.896207401597

Rse

0.0

Rst

-0.0566194448106

Rsv

0.557303115295


Height range @ 1km [m]

1

Height range @ 2km [m]

4

Height range @ 5km [m]

13

Height range @ 10km [m]

-999

Height range @ 20km [m]

-999


Variance slope @ 1 km

3

Variance slope @ 2 km

5

Variance slope @ 5 km

6

Variance slope @ 10 km

-999

Variance slope @ 20 km

-999


NDVI (max. NDVI composite)


Roman et al. (2009) index


St

0.735915660743

Rcv

3.58167292486

Rse

0.0

Rst

-0.050464822567

Rsv

0.444416347063


NDVI range @ 1km [-]

0.03

NDVI range @ 2km [-]

0.05

NDVI range @ 5km [-]

0.36

NDVI range @ 10km [-]

0.42

NDVI range @ 20km [-]

0.39


Variance slope @ 1 km

0.00127008728287

Variance slope @ 2 km

0.0016855880912

Variance slope @ 5 km

0.00163983233117

Variance slope @ 10 km

0.0012687546253

Variance slope @ 20 km

0.000665000252642


NDVI (min. NDVI composite)I


Roman et al. (2009) index


St

0.520776467596

Rcv

5.00022881833

Rse

0.0

Rst

-0.582236243269

Rsv

0.178163896638


NDVI range @ 1km [-]

0.02

NDVI range @ 2km [-]

0.03

NDVI range @ 5km [-]

0.26

NDVI range @ 10km [-]

0.34

NDVI range @ 20km [-]

0.31


NDVI slope @ 1 km

0.00091848380534

NDVI slope @ 2 km

0.00118816404278

NDVI slope @ 5 km

0.00109301502677

NDVI slope @ 10 km

0.000863064347063

NDVI slope @ 20 km

0.000455875025016


Temporal stability analysis

+000 deg (BHR)


BHR statistics

Temporal stability [1/decade]:


abs

rel


Weighted least square:

-99999.0


Ordinary least square:

-99999.0


Probabilities that GCOS criteria is met:

Weighted least square:

-99999.0 %

Ordinary least square:

-99999.0 %


DHR statistics

Temporal stability [1/decade]:


abs

rel


Weighted least square:

-99999.0


Ordinary least square:

-99999.0


Probabilities that GCOS criteria is met:

Weighted least square:

-99999.0 %

Ordinary least square:

-99999.0 %


+057/+063 deg (BHR)


BHR statistics

Temporal stability [1/decade]:


abs

rel


Weighted least square:

None


Ordinary least square:

None


Probabilities that GCOS criteria is met:

Weighted least square:

None %

Ordinary least square:

None %


DHR statistics

Temporal stability [1/decade]:


abs

rel


Weighted least square:

None


Ordinary least square:

None


Probabilities that GCOS criteria is met:

Weighted least square:

None %

Ordinary least square:

None %


Temporal anomaly analyis

The variance of the temporal anomalies provides an additional measure about the stability of the signal AFTER removal of the mean seasonal cylce.

+000 deg


+057/+063 deg