PORTO_VELHO


Location

lon / lat [deg]: -63.95 / -8.77

Source network: AERONET


Geostationary surface albedo (GSA) data


“+000”


“+057/+063”


Landcover information (based on ESA CCI landcover data)


Landcover fractions @ 2km distance


Landcover fractions @ 20 km distance


Legend


Distance to open water bodies [km]:

2.23

Distance to urban areas [km]:

3.88


Radius: 1 km

Number of landcover classes:

2

Dominant landcover type:

30: mosaic cropland (>50%), natural veg. (< 50%)

Fraction of dominant landcover type [%]:

88.0


Radius: 2 km

Number of landcover classes:

6

Dominant landcover type:

30: mosaic cropland (>50%), natural veg. (< 50%)

Fraction of dominant landcover type [%]:

64.0


Radius: 5 km

Number of landcover classes:

9

Dominant landcover type:

30: mosaic cropland (>50%), natural veg. (< 50%)

Fraction of dominant landcover type [%]:

44.0


Radius: 10 km

Number of landcover classes:

8

Dominant landcover type:

30: mosaic cropland (>50%), natural veg. (< 50%)

Fraction of dominant landcover type [%]:

35.0


Radius: 20 km

Number of landcover classes:

9

Dominant landcover type:

50: Tree cover, broadleaved, evergreen, closed to open (>15%)

Fraction of dominant landcover type [%]:

37.0


Disturbances


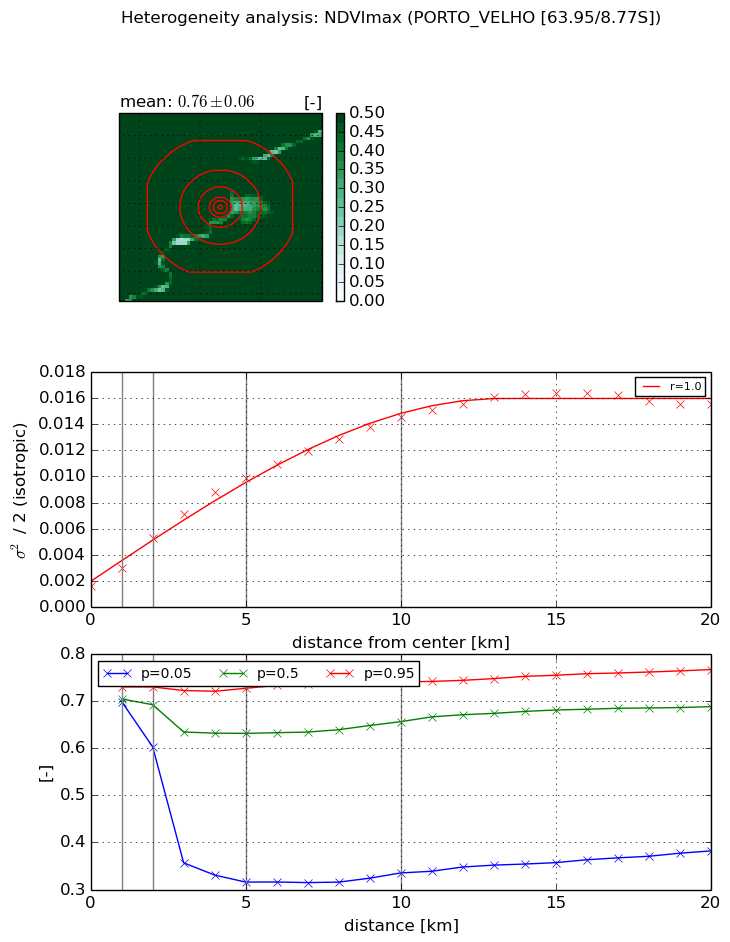
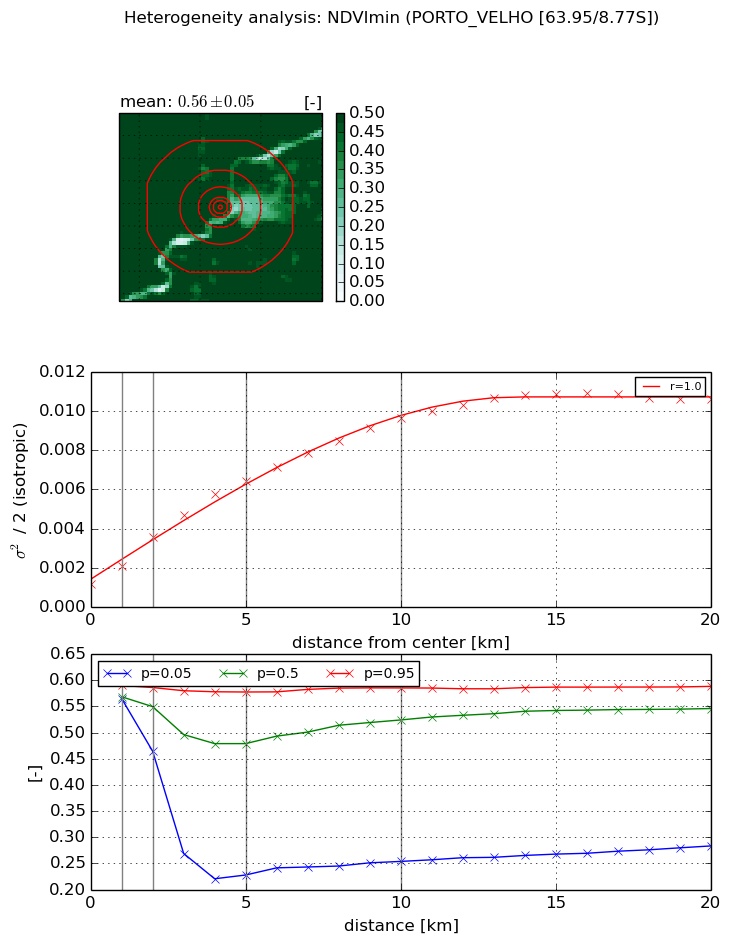
Heterogeneity analysis

The heterogeneity analysis provides information about the spatial and temporal heterogeneity of the site.

Topography


Roman et al. (2009) index


St

3.92710607519

Rcv

0.259816654446

Rse

0.0

Rst

-1.60220466574e-05

Rsv

-0.504088629058


Height range @ 1km [m]

9

Height range @ 2km [m]

17

Height range @ 5km [m]

27

Height range @ 10km [m]

-999

Height range @ 20km [m]

-999


Variance slope @ 1 km

3

Variance slope @ 2 km

6

Variance slope @ 5 km

16

Variance slope @ 10 km

-999

Variance slope @ 20 km

-999


NDVI (max. NDVI composite)


Roman et al. (2009) index


St

8.60313214269e-08

Rcv

0.396493666684

Rse

0.0

Rst

0.135730839635

Rsv

34871020.2802


NDVI range @ 1km [-]

0.03

NDVI range @ 2km [-]

0.13

NDVI range @ 5km [-]

0.41

NDVI range @ 10km [-]

0.41

NDVI range @ 20km [-]

0.39


Variance slope @ 1 km

0.00140568332282

Variance slope @ 2 km

0.00185643153645

Variance slope @ 5 km

0.00172481694489

Variance slope @ 10 km

0.00129626049343

Variance slope @ 20 km

0.00067328586834


NDVI (min. NDVI composite)I


Roman et al. (2009) index


St

2.53892380485

Rcv

0.30516322925

Rse

0.0

Rst

0.00570511508001

Rsv

0.870734661744


NDVI range @ 1km [-]

0.03

NDVI range @ 2km [-]

0.12

NDVI range @ 5km [-]

0.35

NDVI range @ 10km [-]

0.33

NDVI range @ 20km [-]

0.31


NDVI slope @ 1 km

0.000942589163277

NDVI slope @ 2 km

0.00121766632348

NDVI slope @ 5 km

0.0011014364472

NDVI slope @ 10 km

0.000846345943658

NDVI slope @ 20 km

0.000456479226967


Temporal stability analysis

+000 deg (BHR)


BHR statistics

Temporal stability [1/decade]:


abs

rel


Weighted least square:

-99999.0


Ordinary least square:

-99999.0


Probabilities that GCOS criteria is met:

Weighted least square:

-99999.0 %

Ordinary least square:

-99999.0 %


DHR statistics

Temporal stability [1/decade]:


abs

rel


Weighted least square:

-99999.0


Ordinary least square:

-99999.0


Probabilities that GCOS criteria is met:

Weighted least square:

-99999.0 %

Ordinary least square:

-99999.0 %


+057/+063 deg (BHR)


BHR statistics

Temporal stability [1/decade]:


abs

rel


Weighted least square:

None


Ordinary least square:

None


Probabilities that GCOS criteria is met:

Weighted least square:

None %

Ordinary least square:

None %


DHR statistics

Temporal stability [1/decade]:


abs

rel


Weighted least square:

None


Ordinary least square:

None


Probabilities that GCOS criteria is met:

Weighted least square:

None %

Ordinary least square:

None %


Temporal anomaly analyis

The variance of the temporal anomalies provides an additional measure about the stability of the signal AFTER removal of the mean seasonal cylce.

+000 deg


+057/+063 deg