PT-MI2


Location

lon / lat [deg]: -8.0246 / 38.4765

Source network: FLUXNET


Geostationary surface albedo (GSA) data


“+000”


“+057/+063”


Landcover information (based on ESA CCI landcover data)


Landcover fractions @ 2km distance


Landcover fractions @ 20 km distance


Legend


Distance to open water bodies [km]:

0.34

Distance to urban areas [km]:

5.9


Radius: 1 km

Number of landcover classes:

3

Dominant landcover type:

10: cropland, rainfed

Fraction of dominant landcover type [%]:

83.0


Radius: 2 km

Number of landcover classes:

4

Dominant landcover type:

10: cropland, rainfed

Fraction of dominant landcover type [%]:

84.0


Radius: 5 km

Number of landcover classes:

4

Dominant landcover type:

10: cropland, rainfed

Fraction of dominant landcover type [%]:

84.0


Radius: 10 km

Number of landcover classes:

5

Dominant landcover type:

10: cropland, rainfed

Fraction of dominant landcover type [%]:

86.0


Radius: 20 km

Number of landcover classes:

7

Dominant landcover type:

10: cropland, rainfed

Fraction of dominant landcover type [%]:

77.0


Disturbances


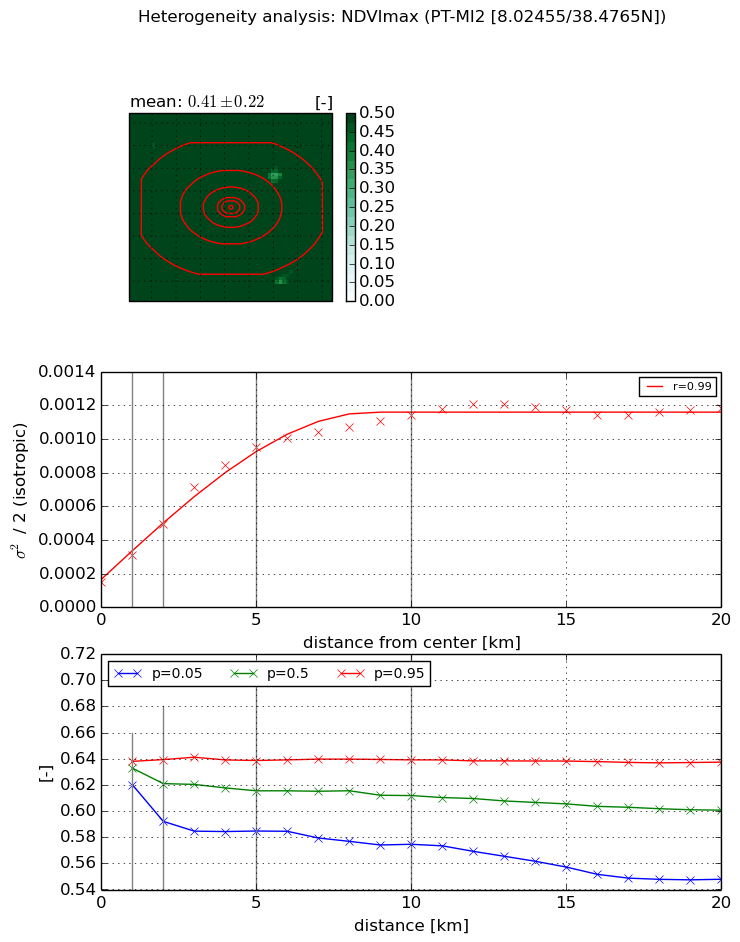
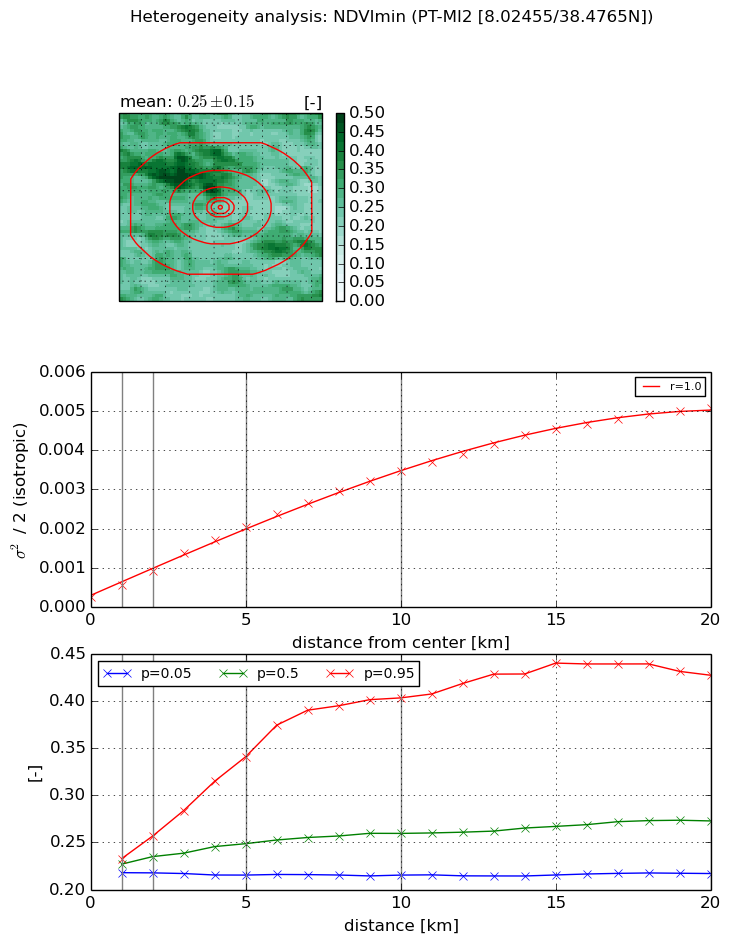
Heterogeneity analysis

The heterogeneity analysis provides information about the spatial and temporal heterogeneity of the site.

Topography


Roman et al. (2009) index


St

6.93995666566e-07

Rcv

0.677178090778

Rse

0.0

Rst

-0.0466075110475

Rsv

4322792.83895


Height range @ 1km [m]

14

Height range @ 2km [m]

20

Height range @ 5km [m]

48

Height range @ 10km [m]

-999

Height range @ 20km [m]

-999


Variance slope @ 1 km

81

Variance slope @ 2 km

79

Variance slope @ 5 km

51

Variance slope @ 10 km

-999

Variance slope @ 20 km

-999


NDVI (max. NDVI composite)


Roman et al. (2009) index


St

13.7219634217

Rcv

-0.0512416730888

Rse

0.0

Rst

0.0385977732811

Rsv

0.128788158719


NDVI range @ 1km [-]

0.02

NDVI range @ 2km [-]

0.05

NDVI range @ 5km [-]

0.05

NDVI range @ 10km [-]

0.06

NDVI range @ 20km [-]

0.09


Variance slope @ 1 km

0.000161539805629

Variance slope @ 2 km

0.000173059873764

Variance slope @ 5 km

0.000166773564403

Variance slope @ 10 km

9.72476757992e-05

Variance slope @ 20 km

4.02132502443e-05


NDVI (min. NDVI composite)I


Roman et al. (2009) index


St

9.40555392971e-08

Rcv

0.774337650259

Rse

0.0

Rst

0.132039149651

Rsv

31896047.1352


NDVI range @ 1km [-]

0.01

NDVI range @ 2km [-]

0.04

NDVI range @ 5km [-]

0.13

NDVI range @ 10km [-]

0.19

NDVI range @ 20km [-]

0.21


NDVI slope @ 1 km

0.000301538954849

NDVI slope @ 2 km

0.000337173076819

NDVI slope @ 5 km

0.000368002168005

NDVI slope @ 10 km

0.00032682963675

NDVI slope @ 20 km

0.00024554899145


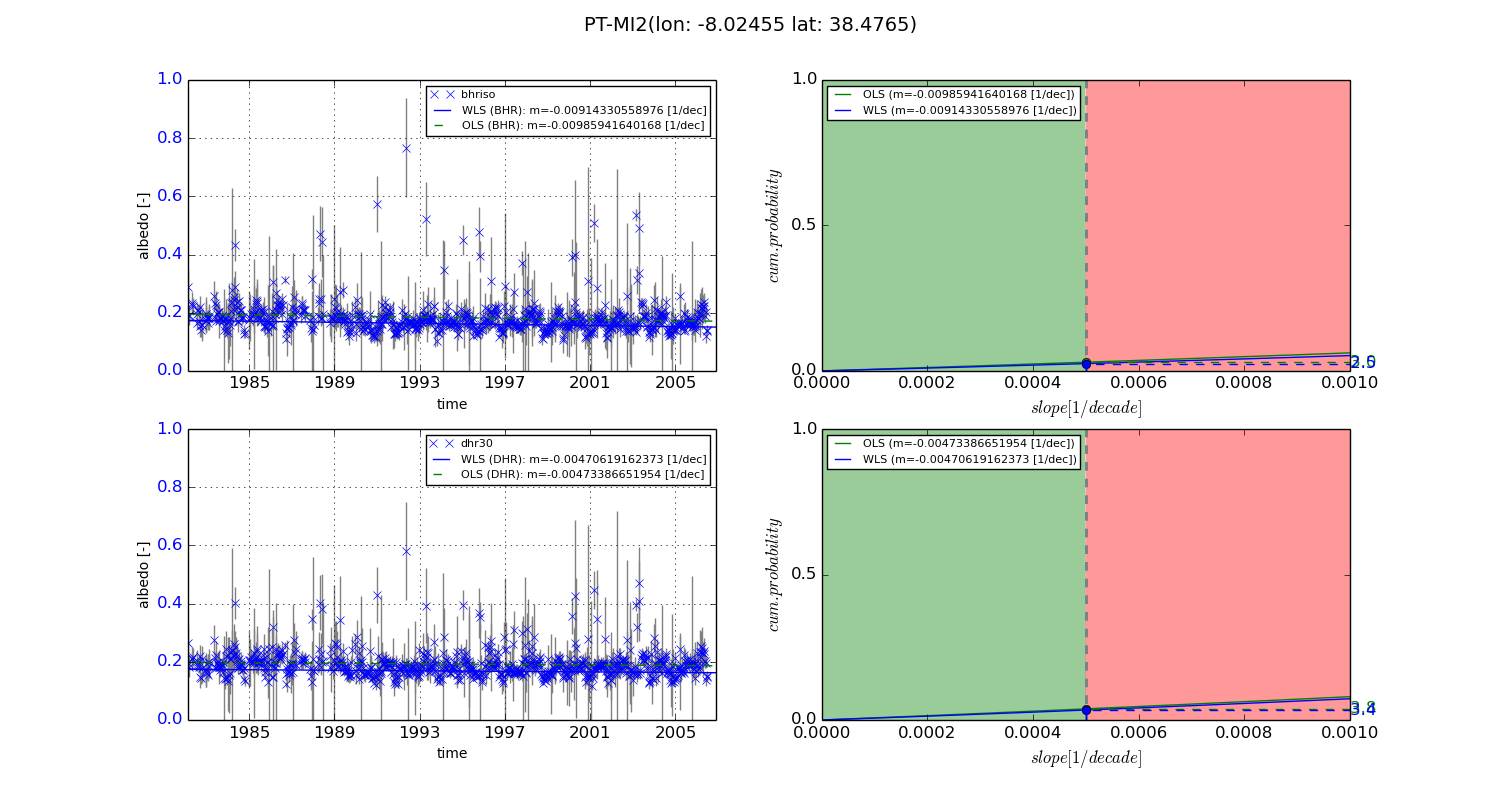
Temporal stability analysis

+000 deg (BHR)


BHR statistics

Temporal stability [1/decade]:


abs

rel


Weighted least square:

-0.00914330558976


Ordinary least square:

-0.00985941640168


Probabilities that GCOS criteria is met:

Weighted least square:

2.5 %

Ordinary least square:

3.0 %


DHR statistics

Temporal stability [1/decade]:


abs

rel


Weighted least square:

-0.00470619162373


Ordinary least square:

-0.00473386651954


Probabilities that GCOS criteria is met:

Weighted least square:

3.4 %

Ordinary least square:

3.8 %


+057/+063 deg (BHR)


BHR statistics

Temporal stability [1/decade]:


abs

rel


Weighted least square:

-99999.0


Ordinary least square:

-99999.0


Probabilities that GCOS criteria is met:

Weighted least square:

-99999.0 %

Ordinary least square:

-99999.0 %


DHR statistics

Temporal stability [1/decade]:


abs

rel


Weighted least square:

-99999.0


Ordinary least square:

-99999.0


Probabilities that GCOS criteria is met:

Weighted least square:

-99999.0 %

Ordinary least square:

-99999.0 %


Temporal anomaly analyis

The variance of the temporal anomalies provides an additional measure about the stability of the signal AFTER removal of the mean seasonal cylce.
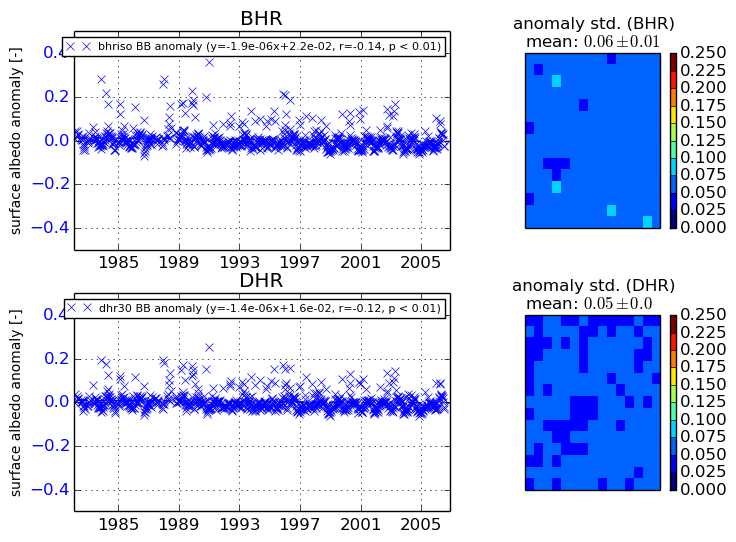
+000 deg


+057/+063 deg