PUNE


Location

lon / lat [deg]: 73.8055 / 18.5373

Source network: AERONET


Geostationary surface albedo (GSA) data


“+000”


“+057/+063”


Landcover information (based on ESA CCI landcover data)


Landcover fractions @ 2km distance


Landcover fractions @ 20 km distance


Legend


Distance to open water bodies [km]:

1.92

Distance to urban areas [km]:

0.14


Radius: 1 km

Number of landcover classes:

1

Dominant landcover type:

190: urban areas

Fraction of dominant landcover type [%]:

100.0


Radius: 2 km

Number of landcover classes:

1

Dominant landcover type:

190: urban areas

Fraction of dominant landcover type [%]:

99.0


Radius: 5 km

Number of landcover classes:

4

Dominant landcover type:

190: urban areas

Fraction of dominant landcover type [%]:

78.0


Radius: 10 km

Number of landcover classes:

4

Dominant landcover type:

190: urban areas

Fraction of dominant landcover type [%]:

65.0


Radius: 20 km

Number of landcover classes:

8

Dominant landcover type:

190: urban areas

Fraction of dominant landcover type [%]:

36.0


Disturbances


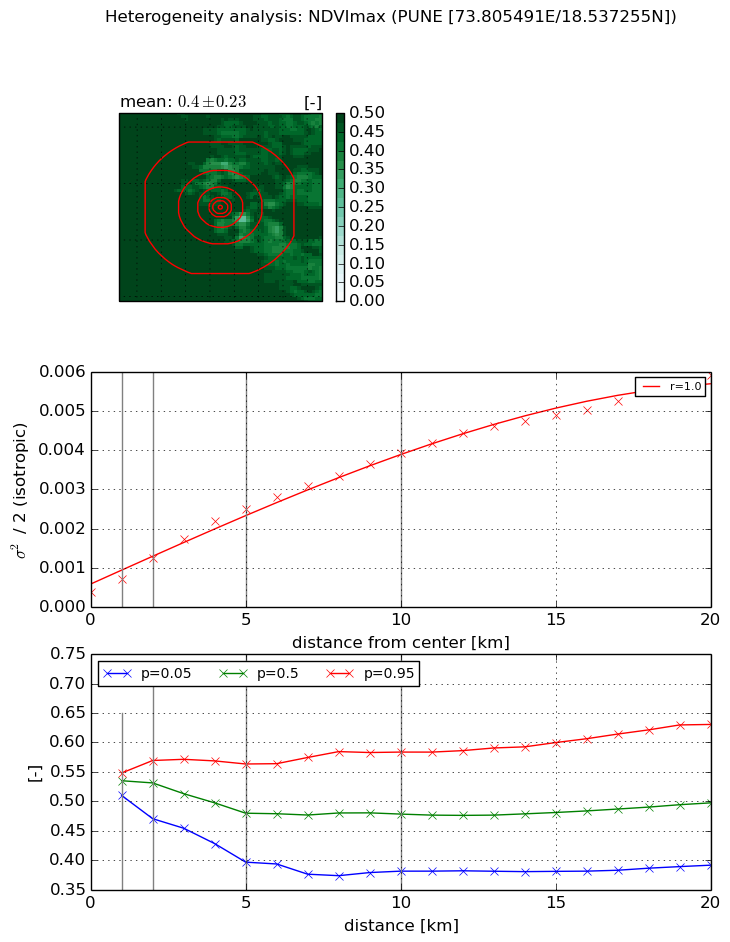
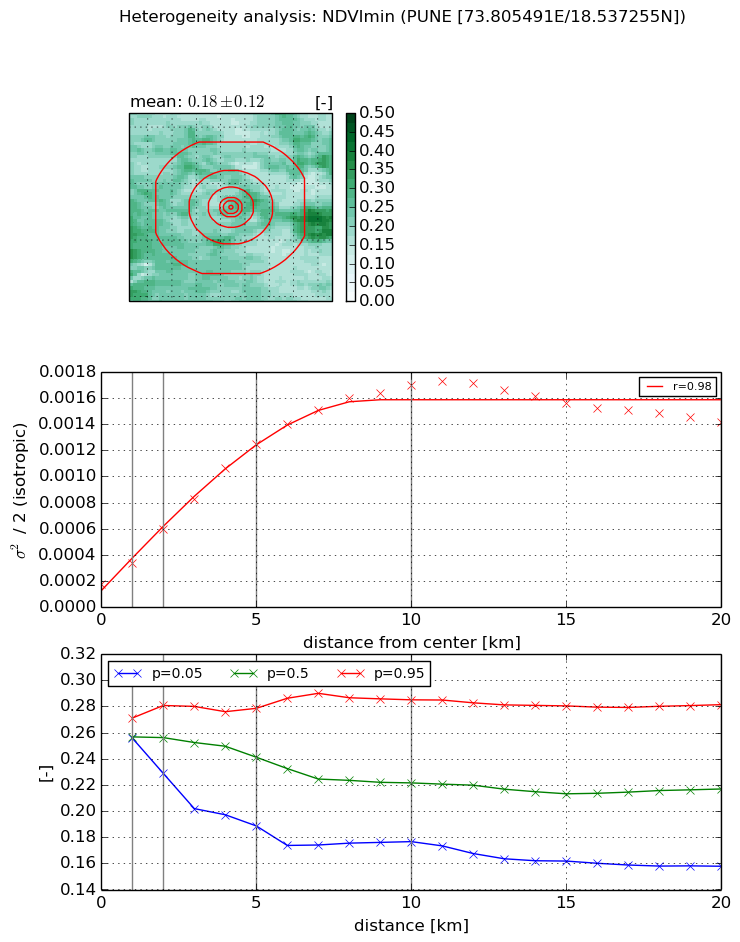
Heterogeneity analysis

The heterogeneity analysis provides information about the spatial and temporal heterogeneity of the site.

Topography


Roman et al. (2009) index


St

9.87900413842

Rcv

0.0459564245016

Rse

0.0

Rst

0.0385768905555

Rsv

0.219141018708


Height range @ 1km [m]

73

Height range @ 2km [m]

107

Height range @ 5km [m]

116

Height range @ 10km [m]

-999

Height range @ 20km [m]

-999


Variance slope @ 1 km

440

Variance slope @ 2 km

363

Variance slope @ 5 km

264

Variance slope @ 10 km

-999

Variance slope @ 20 km

-999


NDVI (max. NDVI composite)


Roman et al. (2009) index


St

3.81062439622

Rcv

0.466174006137

Rse

0.0

Rst

-0.0552764339751

Rsv

0.265822113692


NDVI range @ 1km [-]

0.04

NDVI range @ 2km [-]

0.1

NDVI range @ 5km [-]

0.17

NDVI range @ 10km [-]

0.2

NDVI range @ 20km [-]

0.24


Variance slope @ 1 km

0.000334919416563

Variance slope @ 2 km

0.0004420099117

Variance slope @ 5 km

0.000442668564122

Variance slope @ 10 km

0.000355979840108

Variance slope @ 20 km

0.000263887640019


NDVI (min. NDVI composite)I


Roman et al. (2009) index


St

1.6645366083

Rcv

0.364686303962

Rse

0.0

Rst

-0.341839530673

Rsv

1.09577757224


NDVI range @ 1km [-]

0.02

NDVI range @ 2km [-]

0.05

NDVI range @ 5km [-]

0.09

NDVI range @ 10km [-]

0.11

NDVI range @ 20km [-]

0.12


NDVI slope @ 1 km

0.000158542414391

NDVI slope @ 2 km

0.000209471056135

NDVI slope @ 5 km

0.000222539475444

NDVI slope @ 10 km

0.000159347488647

NDVI slope @ 20 km

5.23089692611e-05


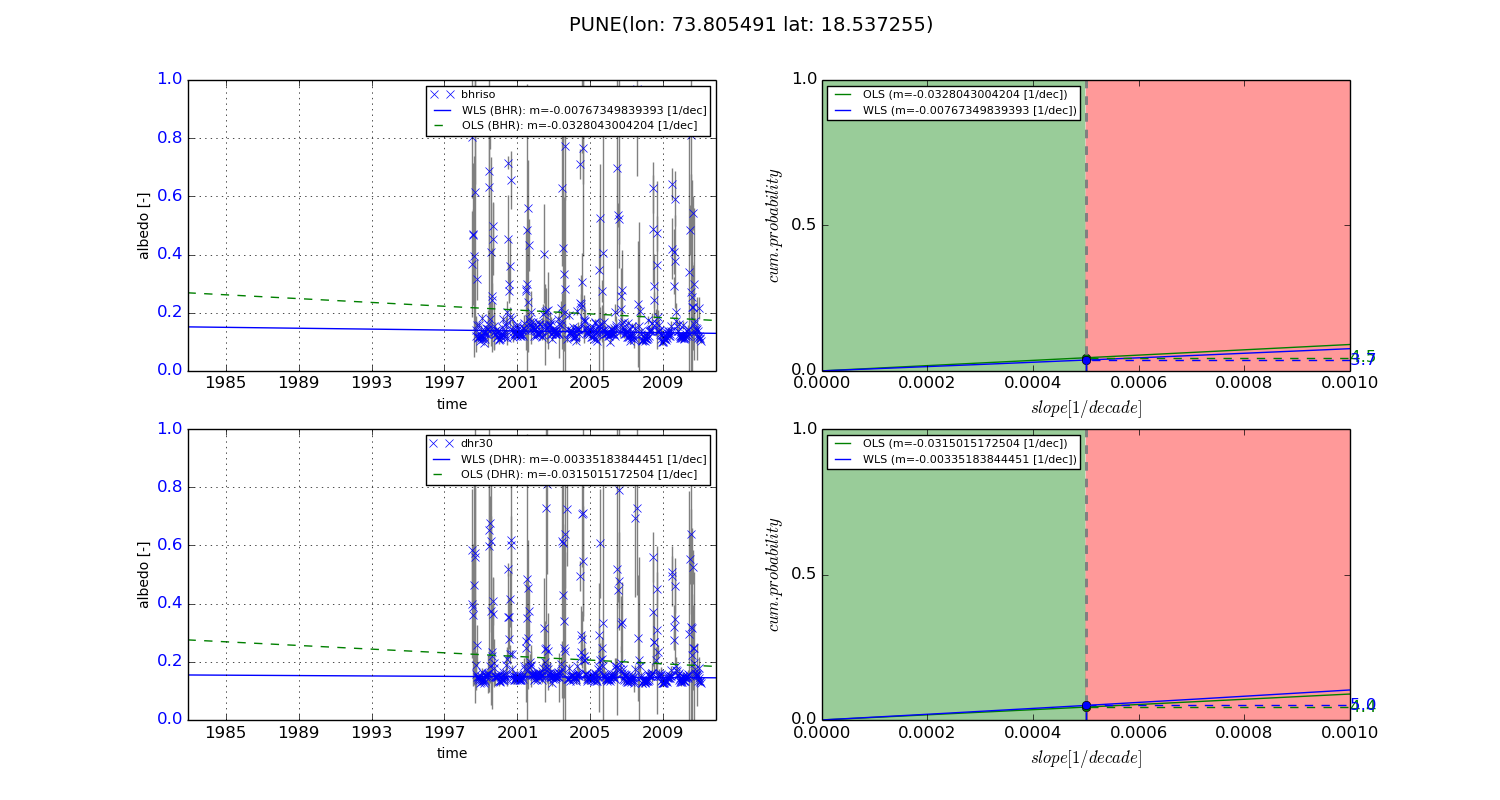
Temporal stability analysis

+000 deg (BHR)


BHR statistics

Temporal stability [1/decade]:


abs

rel


Weighted least square:

-99999.0


Ordinary least square:

-99999.0


Probabilities that GCOS criteria is met:

Weighted least square:

-99999.0 %

Ordinary least square:

-99999.0 %


DHR statistics

Temporal stability [1/decade]:


abs

rel


Weighted least square:

-99999.0


Ordinary least square:

-99999.0


Probabilities that GCOS criteria is met:

Weighted least square:

-99999.0 %

Ordinary least square:

-99999.0 %


+057/+063 deg (BHR)


BHR statistics

Temporal stability [1/decade]:


abs

rel


Weighted least square:

-0.00767349839393


Ordinary least square:

-0.0328043004204


Probabilities that GCOS criteria is met:

Weighted least square:

3.7 %

Ordinary least square:

4.5 %


DHR statistics

Temporal stability [1/decade]:


abs

rel


Weighted least square:

-0.00335183844451


Ordinary least square:

-0.0315015172504


Probabilities that GCOS criteria is met:

Weighted least square:

5.0 %

Ordinary least square:

4.4 %


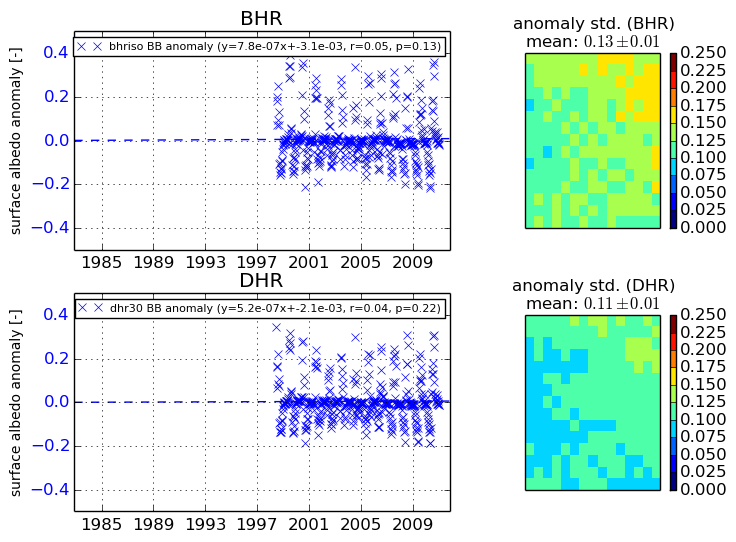
Temporal anomaly analyis

The variance of the temporal anomalies provides an additional measure about the stability of the signal AFTER removal of the mean seasonal cylce.

+000 deg


+057/+063 deg