PUSPIPTEK


Location

lon / lat [deg]: 106.6644 / -6.3556

Source network: AERONET


Geostationary surface albedo (GSA) data


“+000”


“+057/+063”


Landcover information (based on ESA CCI landcover data)


Landcover fractions @ 2km distance


Landcover fractions @ 20 km distance


Legend


Distance to open water bodies [km]:

12.76

Distance to urban areas [km]:

0.54


Radius: 1 km

Number of landcover classes:

3

Dominant landcover type:

30: mosaic cropland (>50%), natural veg. (< 50%)

Fraction of dominant landcover type [%]:

75.0


Radius: 2 km

Number of landcover classes:

5

Dominant landcover type:

30: mosaic cropland (>50%), natural veg. (< 50%)

Fraction of dominant landcover type [%]:

72.0


Radius: 5 km

Number of landcover classes:

5

Dominant landcover type:

30: mosaic cropland (>50%), natural veg. (< 50%)

Fraction of dominant landcover type [%]:

66.0


Radius: 10 km

Number of landcover classes:

5

Dominant landcover type:

30: mosaic cropland (>50%), natural veg. (< 50%)

Fraction of dominant landcover type [%]:

63.0


Radius: 20 km

Number of landcover classes:

6

Dominant landcover type:

30: mosaic cropland (>50%), natural veg. (< 50%)

Fraction of dominant landcover type [%]:

49.0


Disturbances


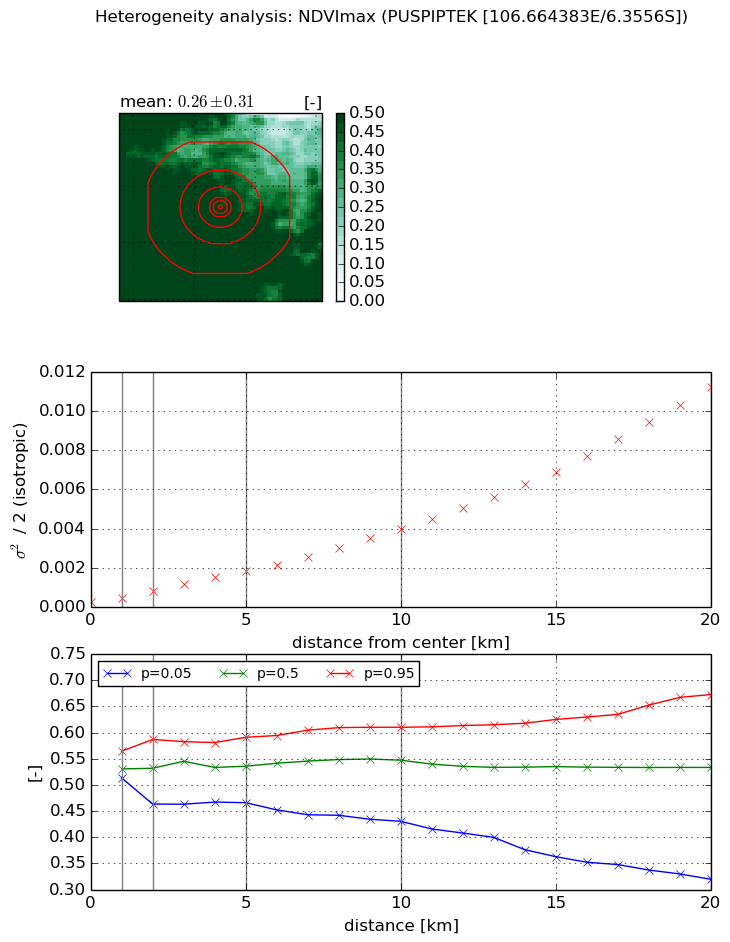
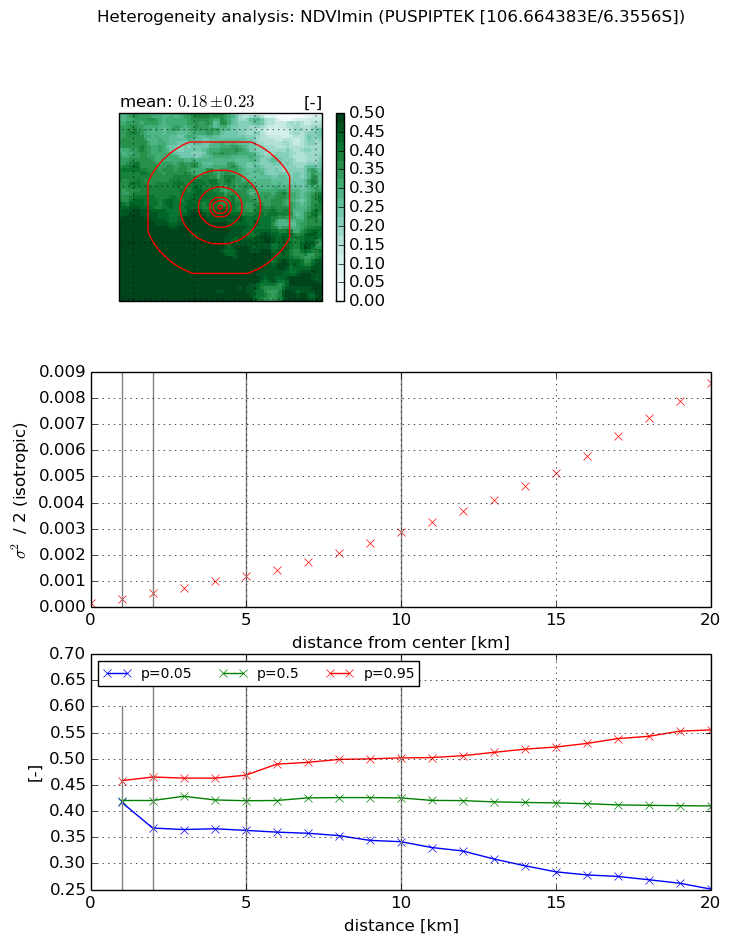
Heterogeneity analysis

The heterogeneity analysis provides information about the spatial and temporal heterogeneity of the site.

Topography


Roman et al. (2009) index


St

8.3262955123

Rcv

-0.0894651582285

Rse

0.0

Rst

-0.0701384137515

Rsv

0.200700718874


Height range @ 1km [m]

30

Height range @ 2km [m]

44

Height range @ 5km [m]

48

Height range @ 10km [m]

-999

Height range @ 20km [m]

-999


Variance slope @ 1 km

80

Variance slope @ 2 km

54

Variance slope @ 5 km

34

Variance slope @ 10 km

-999

Variance slope @ 20 km

-999


NDVI (max. NDVI composite)


Roman et al. (2009) index


St

2.04343811568

Rcv

0.0152812666928

Rse

0.0

Rst

-0.452832849745

Rsv

-0.999999831807


NDVI range @ 1km [-]

0.05

NDVI range @ 2km [-]

0.12

NDVI range @ 5km [-]

0.13

NDVI range @ 10km [-]

0.18

NDVI range @ 20km [-]

0.35


Variance slope @ 1 km

0.000221070380216

Variance slope @ 2 km

0.000295815249562

Variance slope @ 5 km

0.000325174408289

Variance slope @ 10 km

0.000370881042

Variance slope @ 20 km

0.000534965469436


NDVI (min. NDVI composite)I


Roman et al. (2009) index


St

2.258633181

Rcv

0.0585130788846

Rse

0.0

Rst

-0.269724932605

Rsv

-0.99999891748


NDVI range @ 1km [-]

0.04

NDVI range @ 2km [-]

0.1

NDVI range @ 5km [-]

0.11

NDVI range @ 10km [-]

0.16

NDVI range @ 20km [-]

0.3


NDVI slope @ 1 km

0.00013916468791

NDVI slope @ 2 km

0.000186113868123

NDVI slope @ 5 km

0.000211570138178

NDVI slope @ 10 km

0.000264775679058

NDVI slope @ 20 km

0.000414055751544


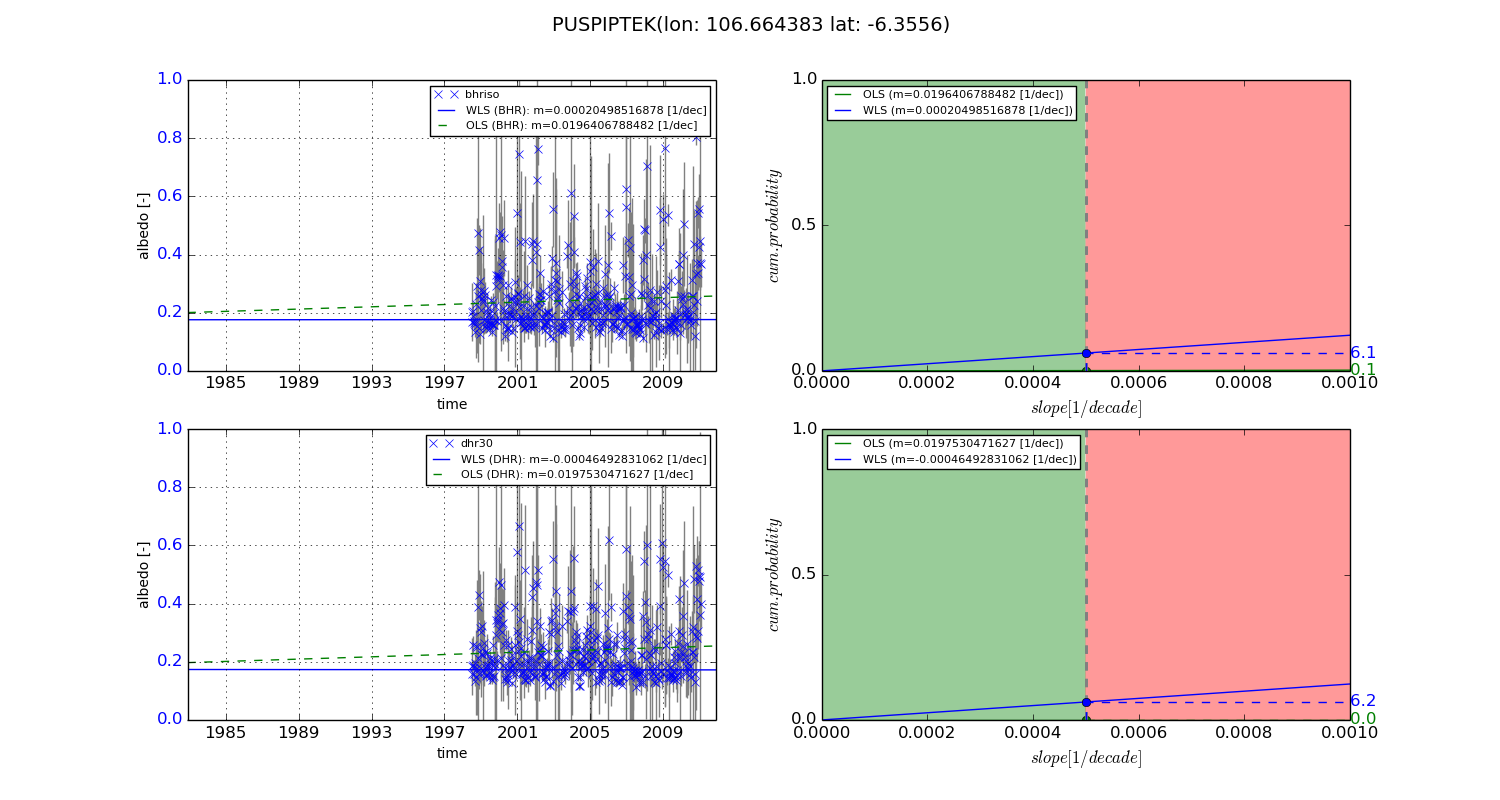
Temporal stability analysis

+000 deg (BHR)


BHR statistics

Temporal stability [1/decade]:


abs

rel


Weighted least square:

None


Ordinary least square:

None


Probabilities that GCOS criteria is met:

Weighted least square:

None %

Ordinary least square:

None %


DHR statistics

Temporal stability [1/decade]:


abs

rel


Weighted least square:

None


Ordinary least square:

None


Probabilities that GCOS criteria is met:

Weighted least square:

None %

Ordinary least square:

None %


+057/+063 deg (BHR)


BHR statistics

Temporal stability [1/decade]:


abs

rel


Weighted least square:

0.00020498516878


Ordinary least square:

0.0196406788482


Probabilities that GCOS criteria is met:

Weighted least square:

6.1 %

Ordinary least square:

0.1 %


DHR statistics

Temporal stability [1/decade]:


abs

rel


Weighted least square:

-0.00046492831062


Ordinary least square:

0.0197530471627


Probabilities that GCOS criteria is met:

Weighted least square:

6.2 %

Ordinary least square:

0.0 %


Temporal anomaly analyis

The variance of the temporal anomalies provides an additional measure about the stability of the signal AFTER removal of the mean seasonal cylce.

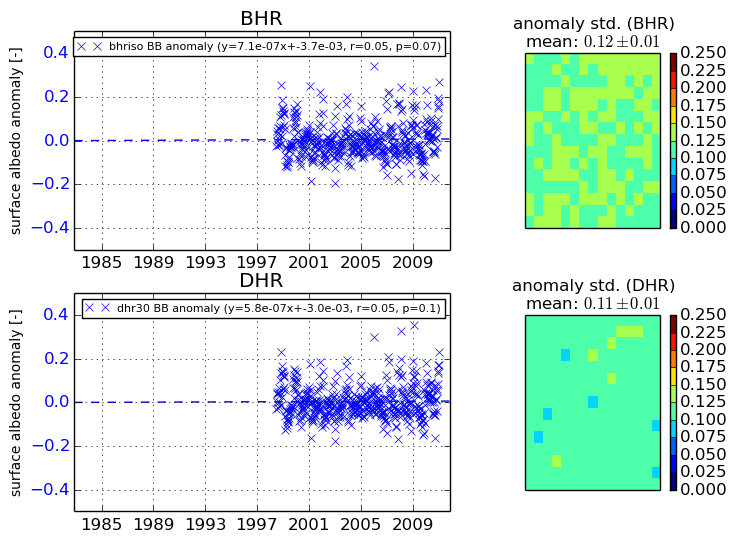
+000 deg


+057/+063 deg