QOMS_CAS


Location

lon / lat [deg]: 86.9481 / 28.365

Source network: AERONET


Geostationary surface albedo (GSA) data


“+000”


“+057/+063”


Landcover information (based on ESA CCI landcover data)


Landcover fractions @ 2km distance


Landcover fractions @ 20 km distance


Legend


Distance to open water bodies [km]:

19.8

Distance to urban areas [km]:

none in region


Radius: 1 km

Number of landcover classes:

2

Dominant landcover type:

130: grassland

Fraction of dominant landcover type [%]:

65.0


Radius: 2 km

Number of landcover classes:

2

Dominant landcover type:

130: grassland

Fraction of dominant landcover type [%]:

76.0


Radius: 5 km

Number of landcover classes:

3

Dominant landcover type:

130: grassland

Fraction of dominant landcover type [%]:

87.0


Radius: 10 km

Number of landcover classes:

3

Dominant landcover type:

130: grassland

Fraction of dominant landcover type [%]:

92.0


Radius: 20 km

Number of landcover classes:

3

Dominant landcover type:

130: grassland

Fraction of dominant landcover type [%]:

92.0


Disturbances


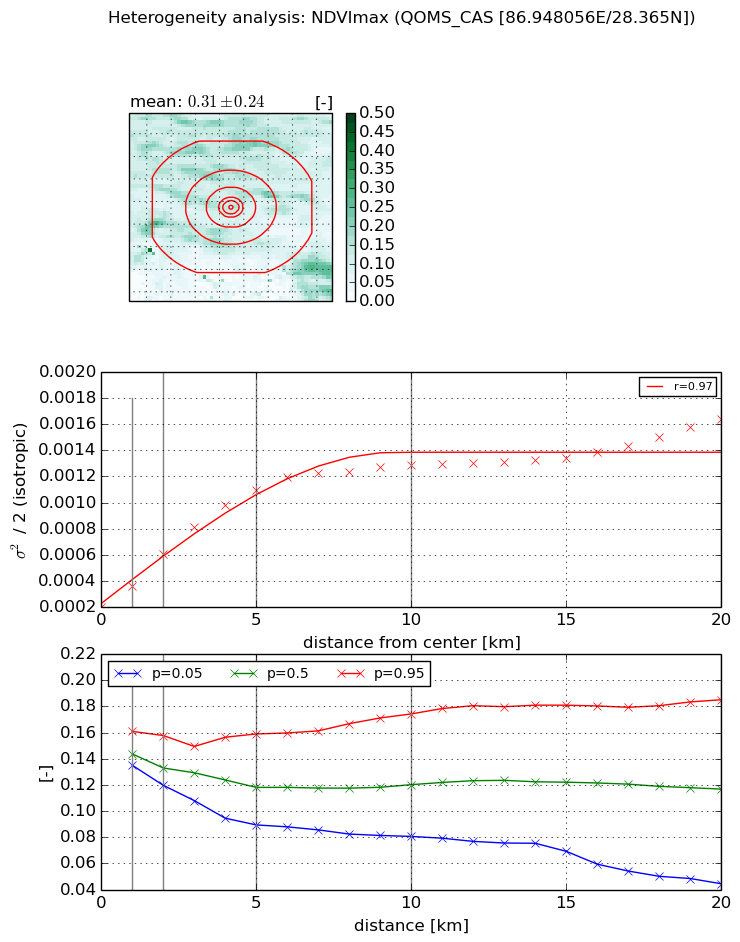
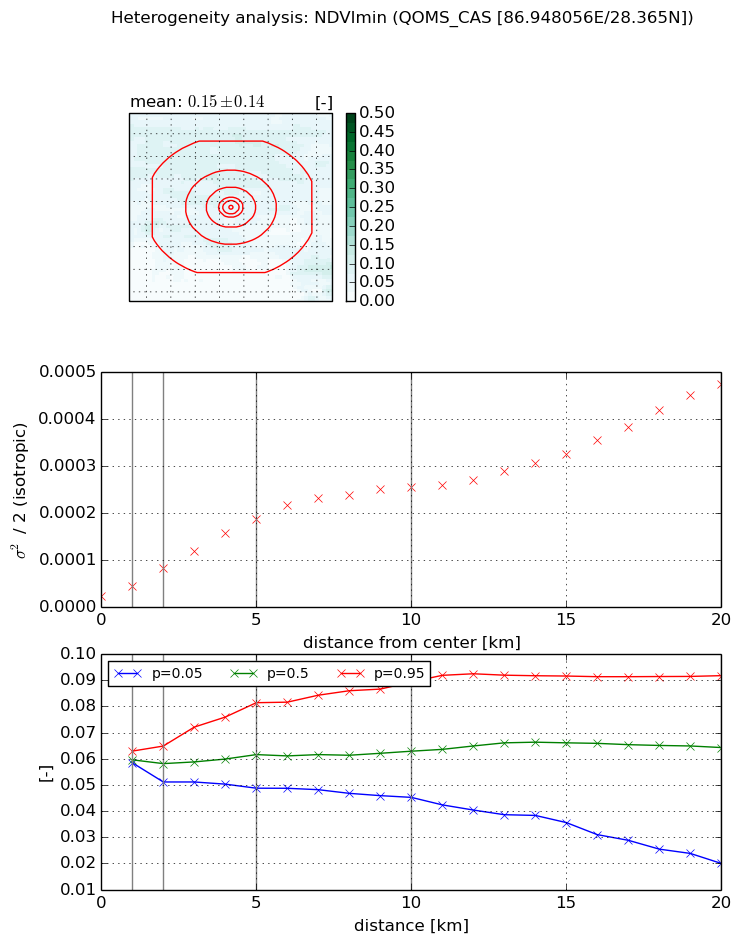
Heterogeneity analysis

The heterogeneity analysis provides information about the spatial and temporal heterogeneity of the site.

Topography


Roman et al. (2009) index


St

3.50380108161

Rcv

0.274364211444

Rse

0.0

Rst

-0.0550959887434

Rsv

0.526752789683


Height range @ 1km [m]

134

Height range @ 2km [m]

377

Height range @ 5km [m]

680

Height range @ 10km [m]

-999

Height range @ 20km [m]

-999


Variance slope @ 1 km

16567

Variance slope @ 2 km

18226

Variance slope @ 5 km

13355

Variance slope @ 10 km

-999

Variance slope @ 20 km

-999


NDVI (max. NDVI composite)


Roman et al. (2009) index


St

0.739624966784

Rcv

0.619712967196

Rse

0.0

Rst

-0.465463193631

Rsv

2.97093353629


NDVI range @ 1km [-]

0.03

NDVI range @ 2km [-]

0.04

NDVI range @ 5km [-]

0.07

NDVI range @ 10km [-]

0.09

NDVI range @ 20km [-]

0.14


Variance slope @ 1 km

0.000161862879821

Variance slope @ 2 km

0.000203763794622

Variance slope @ 5 km

0.000186501182566

Variance slope @ 10 km

0.000108851902638

Variance slope @ 20 km

5.37990442508e-05


NDVI (min. NDVI composite)I


Roman et al. (2009) index


St

2.31171699108

Rcv

0.415266189768

Rse

0.0

Rst

-0.0282805829641

Rsv

0.854189936207


NDVI range @ 1km [-]

0.0

NDVI range @ 2km [-]

0.01

NDVI range @ 5km [-]

0.03

NDVI range @ 10km [-]

0.04

NDVI range @ 20km [-]

0.07


NDVI slope @ 1 km

2.15765331153e-05

NDVI slope @ 2 km

2.93870046814e-05

NDVI slope @ 5 km

3.40475799896e-05

NDVI slope @ 10 km

2.48358117656e-05

NDVI slope @ 20 km

1.96997957105e-05


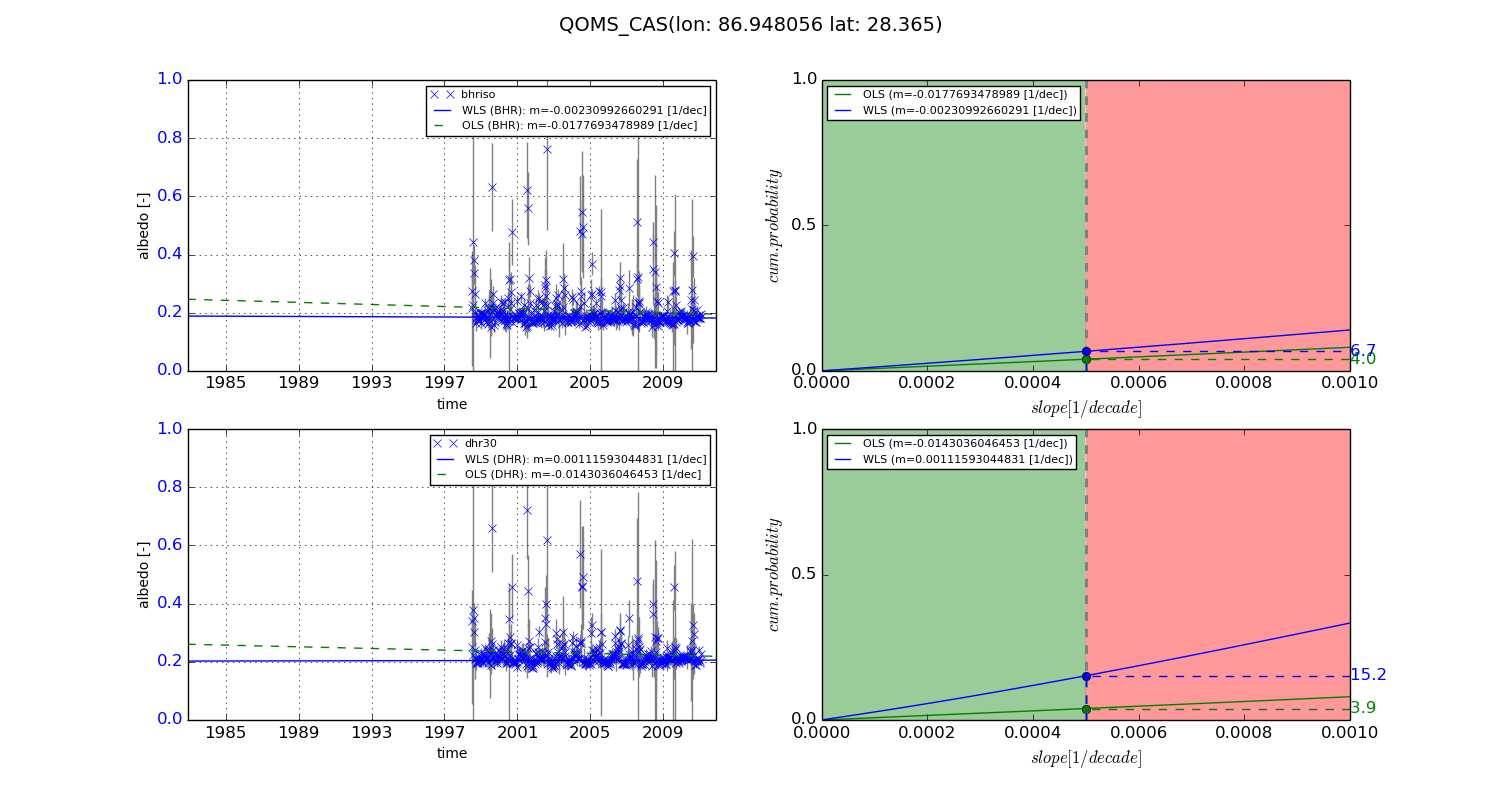
Temporal stability analysis

+000 deg (BHR)


BHR statistics

Temporal stability [1/decade]:


abs

rel


Weighted least square:

None


Ordinary least square:

None


Probabilities that GCOS criteria is met:

Weighted least square:

None %

Ordinary least square:

None %


DHR statistics

Temporal stability [1/decade]:


abs

rel


Weighted least square:

None


Ordinary least square:

None


Probabilities that GCOS criteria is met:

Weighted least square:

None %

Ordinary least square:

None %


+057/+063 deg (BHR)


BHR statistics

Temporal stability [1/decade]:


abs

rel


Weighted least square:

-0.00230992660291


Ordinary least square:

-0.0177693478989


Probabilities that GCOS criteria is met:

Weighted least square:

6.7 %

Ordinary least square:

4.0 %


DHR statistics

Temporal stability [1/decade]:


abs

rel


Weighted least square:

0.00111593044831


Ordinary least square:

-0.0143036046453


Probabilities that GCOS criteria is met:

Weighted least square:

15.2 %

Ordinary least square:

3.9 %


Temporal anomaly analyis

The variance of the temporal anomalies provides an additional measure about the stability of the signal AFTER removal of the mean seasonal cylce.

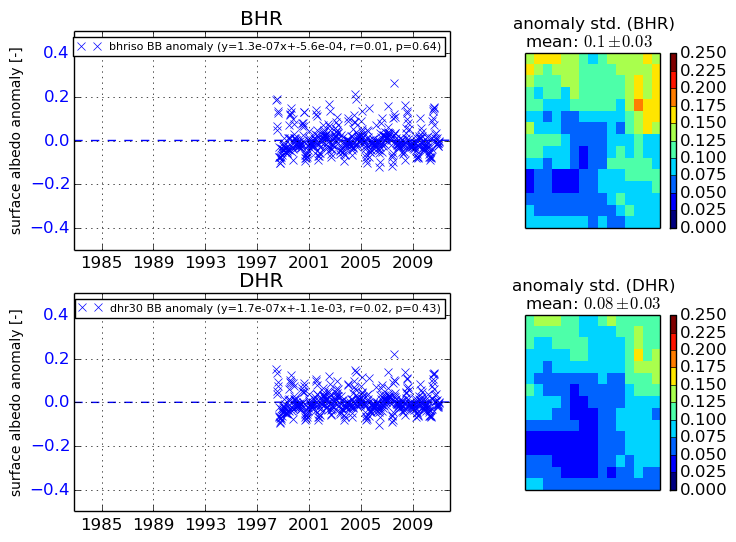
+000 deg


+057/+063 deg