QOZ_EL_HARR


Location

lon / lat [deg]: 32.68 / 16.71

Source network: ALBEDOVAL1


Geostationary surface albedo (GSA) data


“+000”


“+057/+063”


Landcover information (based on ESA CCI landcover data)


Landcover fractions @ 2km distance


Landcover fractions @ 20 km distance


Legend


Distance to open water bodies [km]:

26.15

Distance to urban areas [km]:

none in region


Radius: 1 km

Number of landcover classes:

1

Dominant landcover type:

200: bare areas

Fraction of dominant landcover type [%]:

100.0


Radius: 2 km

Number of landcover classes:

1

Dominant landcover type:

200: bare areas

Fraction of dominant landcover type [%]:

100.0


Radius: 5 km

Number of landcover classes:

1

Dominant landcover type:

200: bare areas

Fraction of dominant landcover type [%]:

100.0


Radius: 10 km

Number of landcover classes:

1

Dominant landcover type:

200: bare areas

Fraction of dominant landcover type [%]:

100.0


Radius: 20 km

Number of landcover classes:

1

Dominant landcover type:

200: bare areas

Fraction of dominant landcover type [%]:

100.0


Disturbances


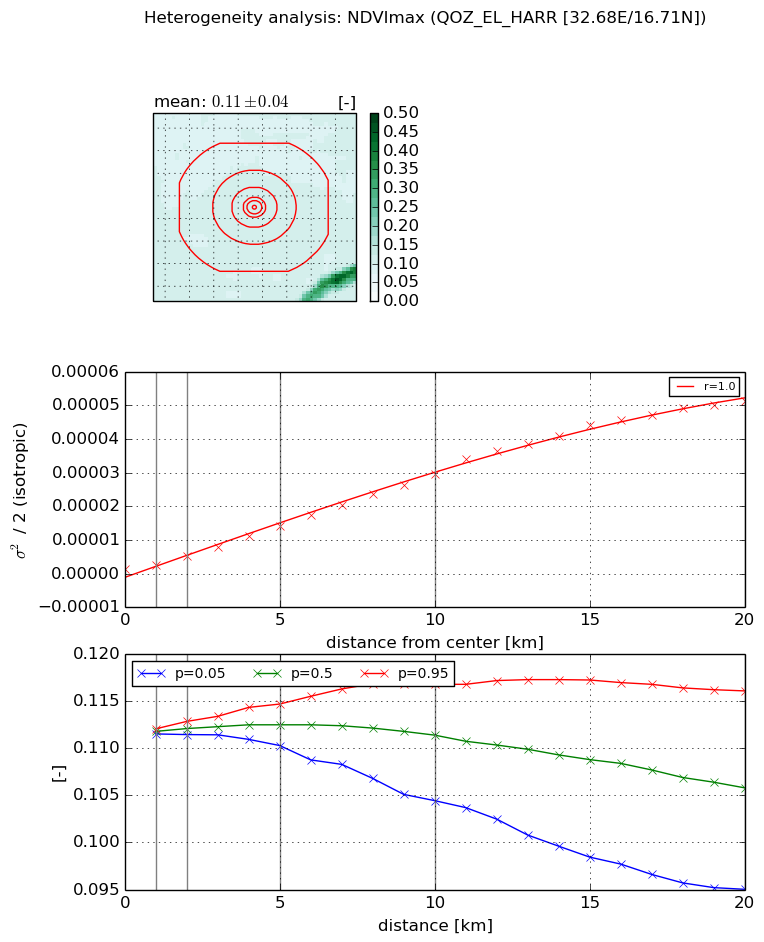
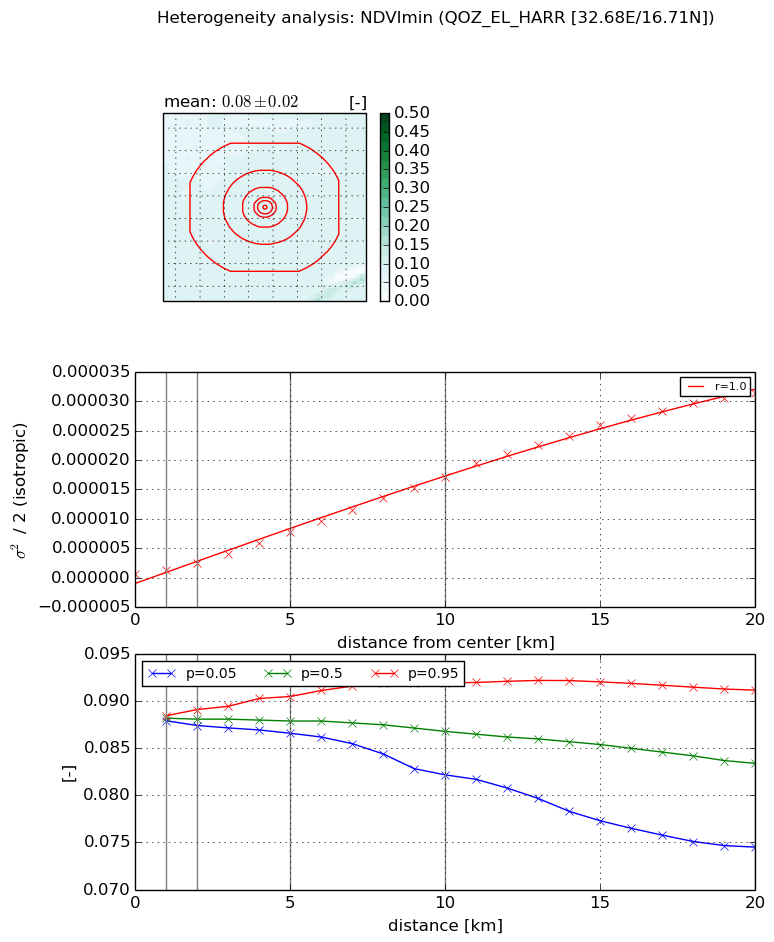
Heterogeneity analysis

The heterogeneity analysis provides information about the spatial and temporal heterogeneity of the site.

Topography


Roman et al. (2009) index


St

1.74847749184

Rcv

0.860365013691

Rse

0.0

Rst

-9.27013807152e-08

Rsv

-0.855413343148


Height range @ 1km [m]

6

Height range @ 2km [m]

8

Height range @ 5km [m]

22

Height range @ 10km [m]

-999

Height range @ 20km [m]

-999


Variance slope @ 1 km

5

Variance slope @ 2 km

6

Variance slope @ 5 km

8

Variance slope @ 10 km

-999

Variance slope @ 20 km

-999


NDVI (max. NDVI composite)


Roman et al. (2009) index


St

1.35118578646

Rcv

1.00883731267

Rse

0.0

Rst

-0.287183422717

Rsv

0.924251287941


NDVI range @ 1km [-]

0.0

NDVI range @ 2km [-]

0.0

NDVI range @ 5km [-]

0.0

NDVI range @ 10km [-]

0.01

NDVI range @ 20km [-]

0.02


Variance slope @ 1 km

1.30506669839e-06

Variance slope @ 2 km

1.90431157175e-06

Variance slope @ 5 km

2.6563870783e-06

Variance slope @ 10 km

2.95487520595e-06

Variance slope @ 20 km

2.7227454679e-06


NDVI (min. NDVI composite)I


Roman et al. (2009) index


St

1.46523611463

Rcv

0.729911224455

Rse

0.0

Rst

-0.317540486298

Rsv

-0.999999870631


NDVI range @ 1km [-]

0.0

NDVI range @ 2km [-]

0.0

NDVI range @ 5km [-]

0.0

NDVI range @ 10km [-]

0.01

NDVI range @ 20km [-]

0.02


NDVI slope @ 1 km

6.55067102219e-07

NDVI slope @ 2 km

9.79367906988e-07

NDVI slope @ 5 km

1.46692497623e-06

NDVI slope @ 10 km

1.72881163031e-06

NDVI slope @ 20 km

1.67076355622e-06


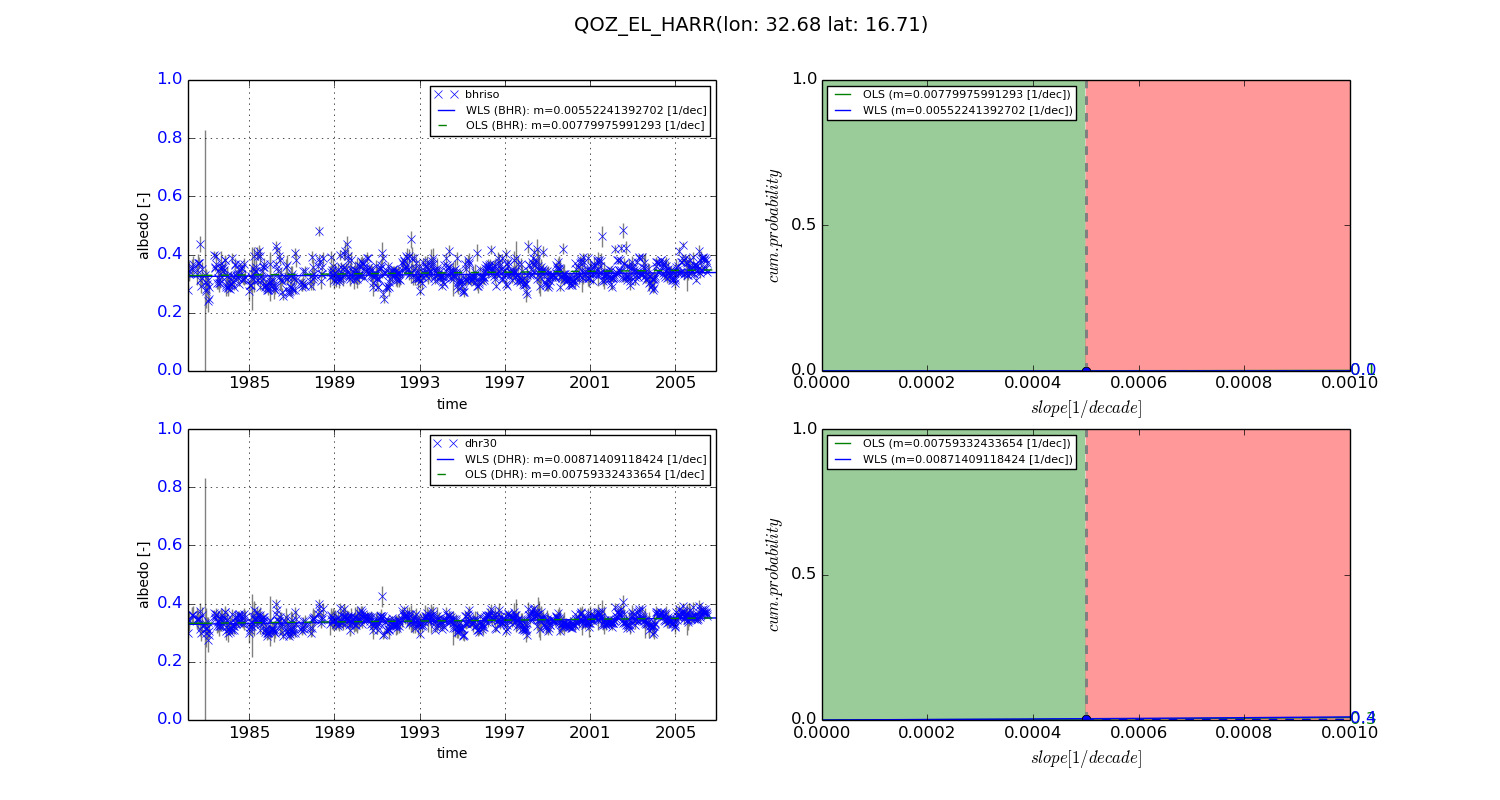
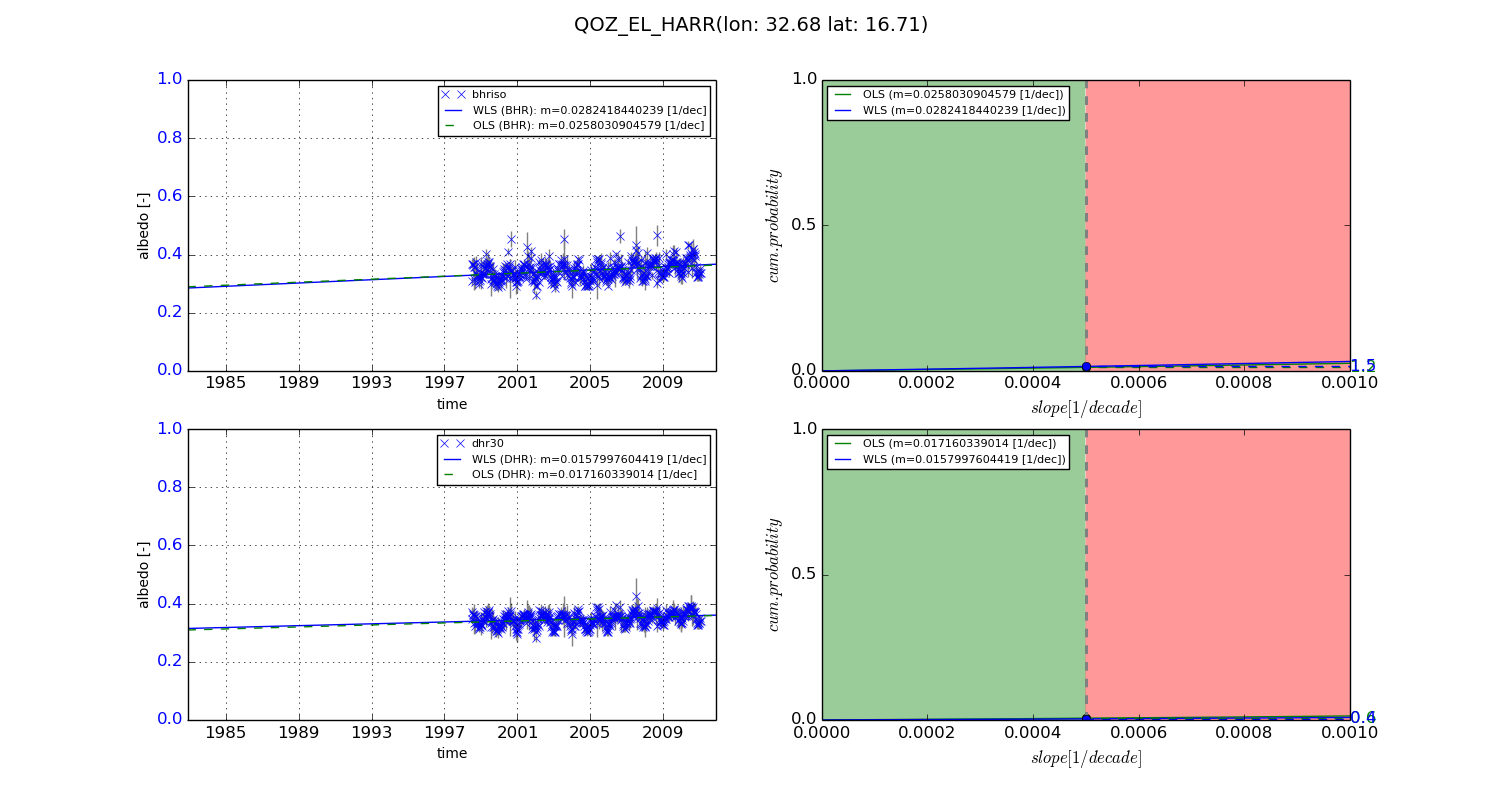
Temporal stability analysis

+000 deg (BHR)


BHR statistics

Temporal stability [1/decade]:


abs

rel


Weighted least square:

0.00552241392702


Ordinary least square:

0.00779975991293


Probabilities that GCOS criteria is met:

Weighted least square:

0.0 %

Ordinary least square:

0.1 %


DHR statistics

Temporal stability [1/decade]:


abs

rel


Weighted least square:

0.00871409118424


Ordinary least square:

0.00759332433654


Probabilities that GCOS criteria is met:

Weighted least square:

0.4 %

Ordinary least square:

0.3 %


+057/+063 deg (BHR)


BHR statistics

Temporal stability [1/decade]:


abs

rel


Weighted least square:

0.0282418440239


Ordinary least square:

0.0258030904579


Probabilities that GCOS criteria is met:

Weighted least square:

1.5 %

Ordinary least square:

1.2 %


DHR statistics

Temporal stability [1/decade]:


abs

rel


Weighted least square:

0.0157997604419


Ordinary least square:

0.017160339014


Probabilities that GCOS criteria is met:

Weighted least square:

0.4 %

Ordinary least square:

0.6 %


Temporal anomaly analyis

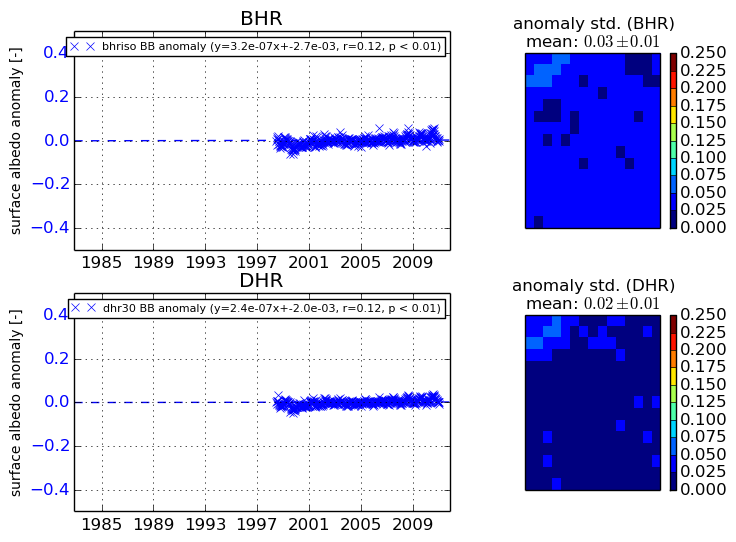
The variance of the temporal anomalies provides an additional measure about the stability of the signal AFTER removal of the mean seasonal cylce.
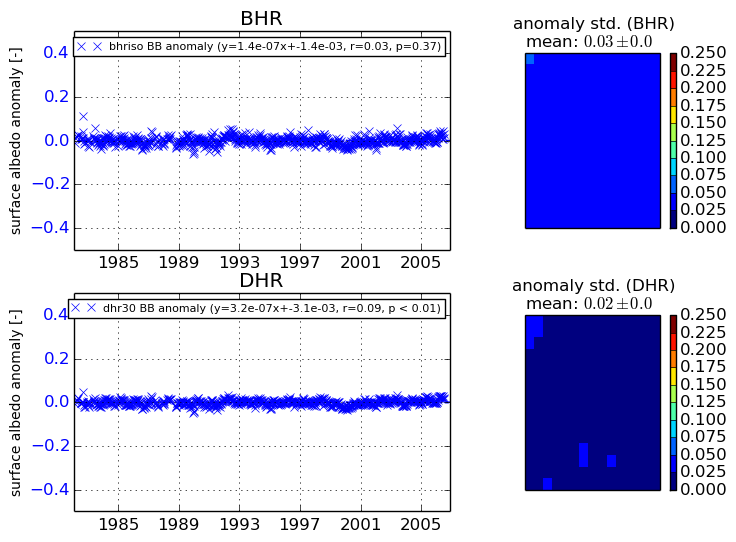
+000 deg


+057/+063 deg