RAS_EL_AIN


Location

lon / lat [deg]: -7.5994 / 31.6703

Source network: AERONET


Geostationary surface albedo (GSA) data


“+000”


“+057/+063”


Landcover information (based on ESA CCI landcover data)


Landcover fractions @ 2km distance


Landcover fractions @ 20 km distance


Legend


Distance to open water bodies [km]:

8.98

Distance to urban areas [km]:

11.35


Radius: 1 km

Number of landcover classes:

1

Dominant landcover type:

10: cropland, rainfed

Fraction of dominant landcover type [%]:

100.0


Radius: 2 km

Number of landcover classes:

2

Dominant landcover type:

10: cropland, rainfed

Fraction of dominant landcover type [%]:

99.0


Radius: 5 km

Number of landcover classes:

2

Dominant landcover type:

10: cropland, rainfed

Fraction of dominant landcover type [%]:

90.0


Radius: 10 km

Number of landcover classes:

2

Dominant landcover type:

10: cropland, rainfed

Fraction of dominant landcover type [%]:

85.0


Radius: 20 km

Number of landcover classes:

2

Dominant landcover type:

10: cropland, rainfed

Fraction of dominant landcover type [%]:

70.0


Disturbances


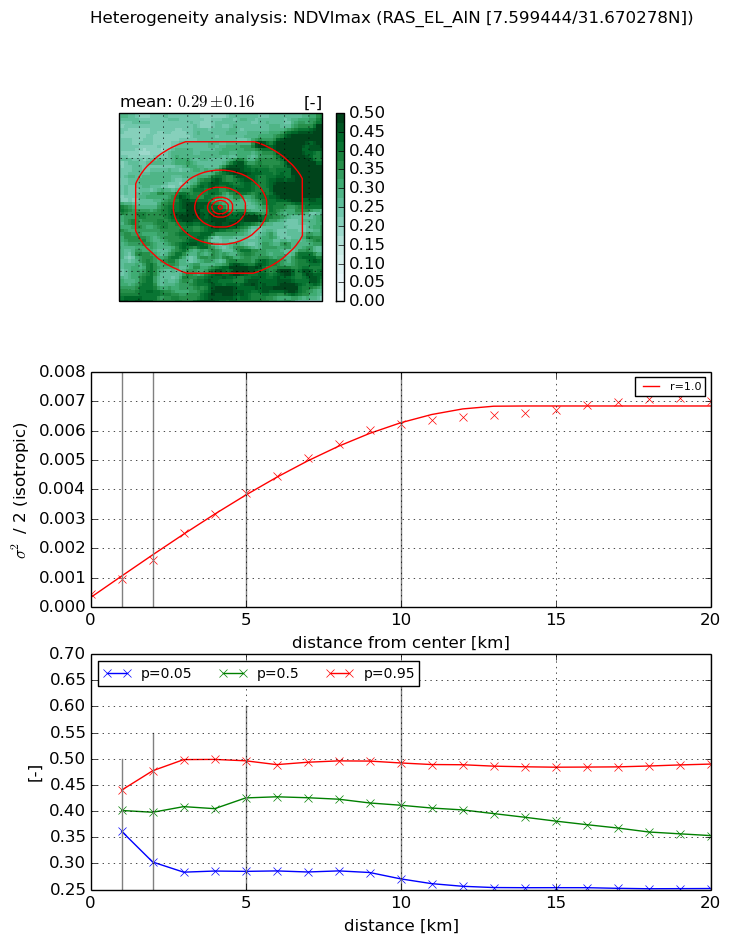
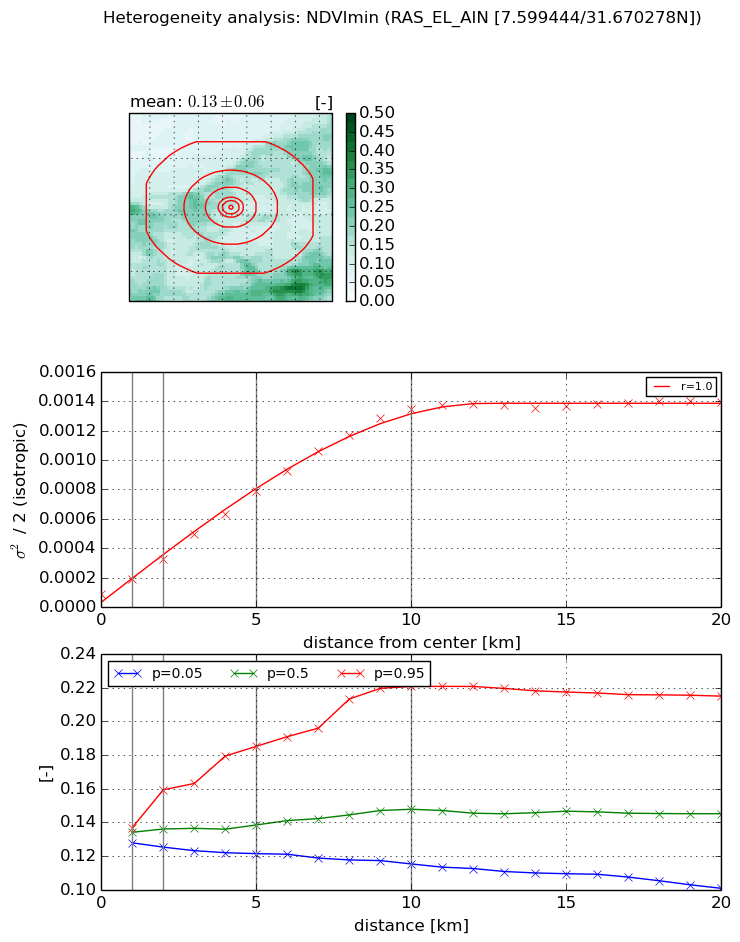
Heterogeneity analysis

The heterogeneity analysis provides information about the spatial and temporal heterogeneity of the site.

Topography


Roman et al. (2009) index


St

0.17128339864

Rcv

0.682454677039

Rse

0.0

Rst

1.64367429826e-05

Rsv

16.832361169


Height range @ 1km [m]

12

Height range @ 2km [m]

25

Height range @ 5km [m]

65

Height range @ 10km [m]

-999

Height range @ 20km [m]

-999


Variance slope @ 1 km

18

Variance slope @ 2 km

35

Variance slope @ 5 km

82

Variance slope @ 10 km

-999

Variance slope @ 20 km

-999


NDVI (max. NDVI composite)


Roman et al. (2009) index


St

1.71459900363e-07

Rcv

-0.0510296179882

Rse

0.0

Rst

0.275116149872

Rsv

17496802.0962


NDVI range @ 1km [-]

0.08

NDVI range @ 2km [-]

0.17

NDVI range @ 5km [-]

0.21

NDVI range @ 10km [-]

0.22

NDVI range @ 20km [-]

0.24


Variance slope @ 1 km

0.000501792227158

Variance slope @ 2 km

0.000586258646122

Variance slope @ 5 km

0.000710837119833

Variance slope @ 10 km

0.000613134646089

Variance slope @ 20 km

0.00032198198084


NDVI (min. NDVI composite)I


Roman et al. (2009) index


St

1.75037207825e-07

Rcv

0.438792411885

Rse

0.0

Rst

0.22913552562

Rsv

17139212.4016


NDVI range @ 1km [-]

0.01

NDVI range @ 2km [-]

0.03

NDVI range @ 5km [-]

0.06

NDVI range @ 10km [-]

0.11

NDVI range @ 20km [-]

0.11


NDVI slope @ 1 km

0.000104837172489

NDVI slope @ 2 km

0.000118235432551

NDVI slope @ 5 km

0.000142462807852

NDVI slope @ 10 km

0.000132716940013

NDVI slope @ 20 km

6.39373932804e-05


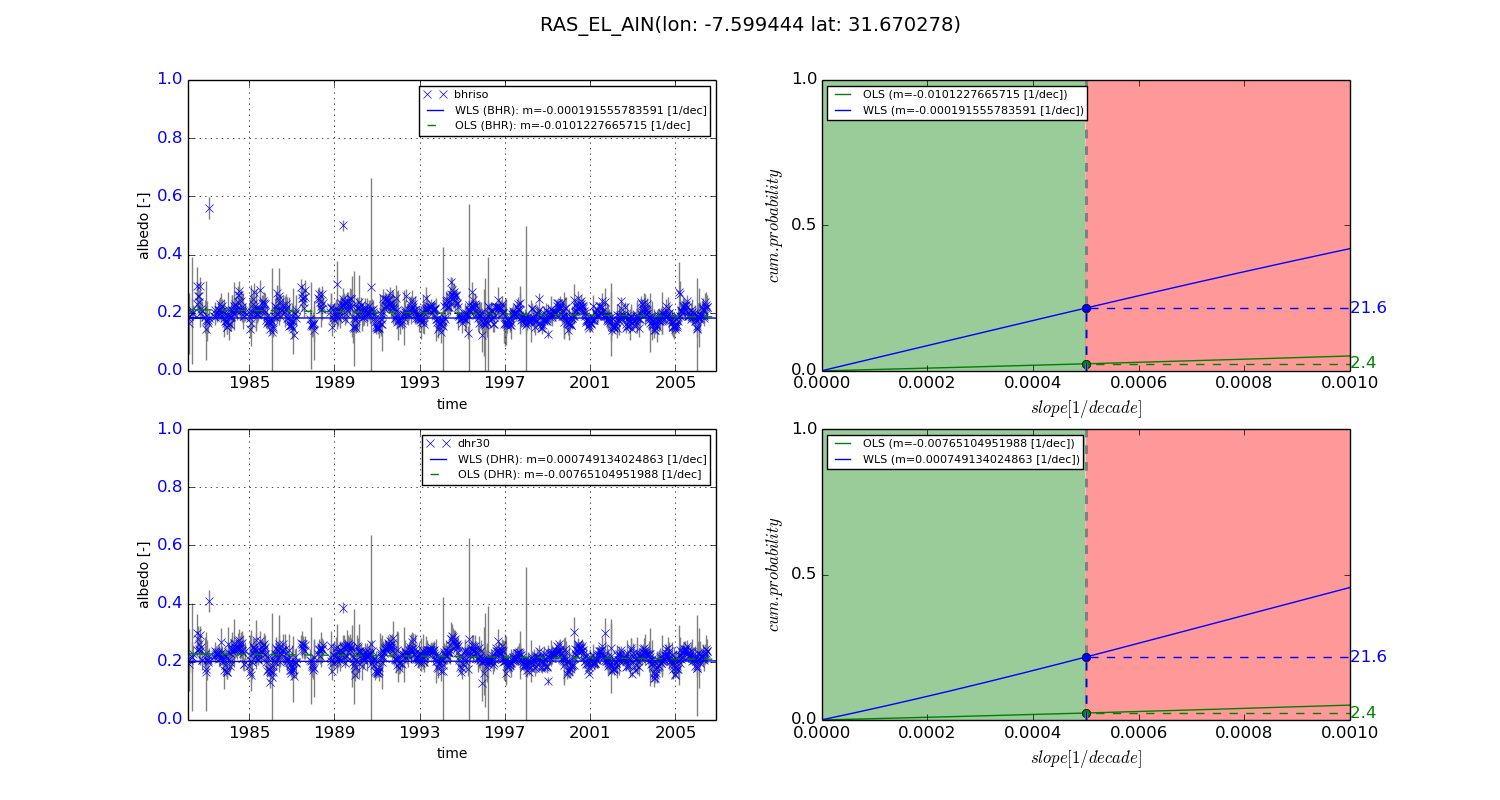
Temporal stability analysis

+000 deg (BHR)


BHR statistics

Temporal stability [1/decade]:


abs

rel


Weighted least square:

-0.000191555783591


Ordinary least square:

-0.0101227665715


Probabilities that GCOS criteria is met:

Weighted least square:

21.6 %

Ordinary least square:

2.4 %


DHR statistics

Temporal stability [1/decade]:


abs

rel


Weighted least square:

0.000749134024863


Ordinary least square:

-0.00765104951988


Probabilities that GCOS criteria is met:

Weighted least square:

21.6 %

Ordinary least square:

2.4 %


+057/+063 deg (BHR)


BHR statistics

Temporal stability [1/decade]:


abs

rel


Weighted least square:

-99999.0


Ordinary least square:

-99999.0


Probabilities that GCOS criteria is met:

Weighted least square:

-99999.0 %

Ordinary least square:

-99999.0 %


DHR statistics

Temporal stability [1/decade]:


abs

rel


Weighted least square:

-99999.0


Ordinary least square:

-99999.0


Probabilities that GCOS criteria is met:

Weighted least square:

-99999.0 %

Ordinary least square:

-99999.0 %


Temporal anomaly analyis

The variance of the temporal anomalies provides an additional measure about the stability of the signal AFTER removal of the mean seasonal cylce.
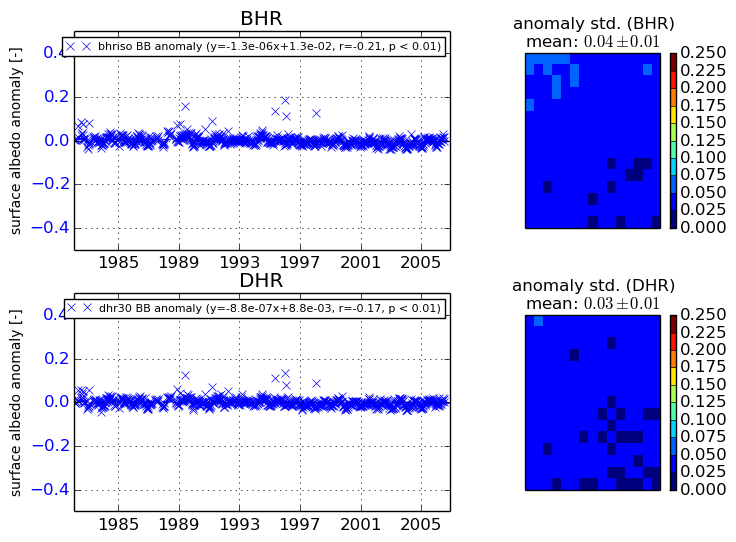
+000 deg


+057/+063 deg