RED_BLUFF


Location

lon / lat [deg]: -122.25 / 40.15

Source network: AERONET


Geostationary surface albedo (GSA) data


“+000”


“+057/+063”


Landcover information (based on ESA CCI landcover data)


Landcover fractions @ 2km distance


Landcover fractions @ 20 km distance


Legend


Distance to open water bodies [km]:

3.01

Distance to urban areas [km]:

0.19


Radius: 1 km

Number of landcover classes:

2

Dominant landcover type:

190: urban areas

Fraction of dominant landcover type [%]:

57.0


Radius: 2 km

Number of landcover classes:

2

Dominant landcover type:

130: grassland

Fraction of dominant landcover type [%]:

60.0


Radius: 5 km

Number of landcover classes:

3

Dominant landcover type:

130: grassland

Fraction of dominant landcover type [%]:

70.0


Radius: 10 km

Number of landcover classes:

3

Dominant landcover type:

130: grassland

Fraction of dominant landcover type [%]:

80.0


Radius: 20 km

Number of landcover classes:

4

Dominant landcover type:

130: grassland

Fraction of dominant landcover type [%]:

85.0


Disturbances


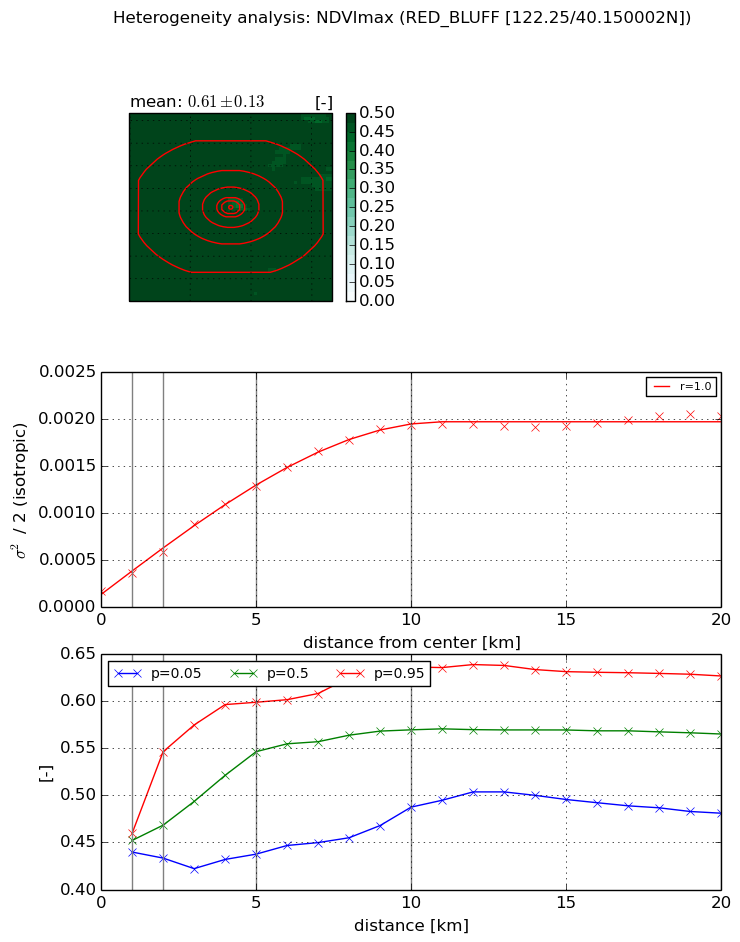
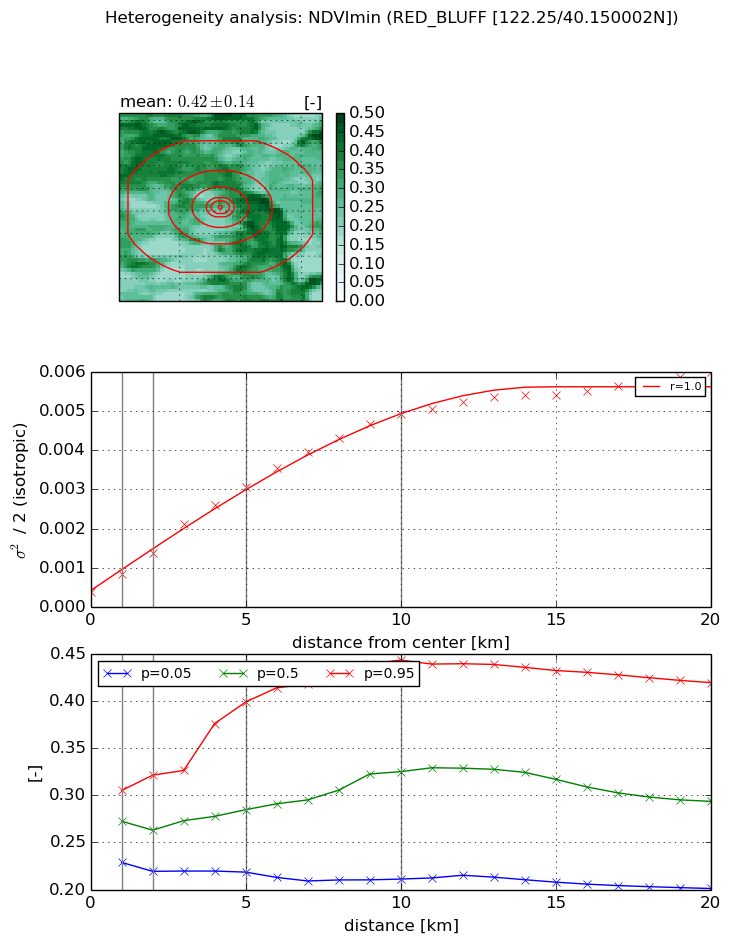
Heterogeneity analysis

The heterogeneity analysis provides information about the spatial and temporal heterogeneity of the site.

Topography


Roman et al. (2009) index


St

2.22114690214

Rcv

0.454488337007

Rse

0.0

Rst

-3.7633740556e-07

Rsv

-0.896164859865


Height range @ 1km [m]

11

Height range @ 2km [m]

24

Height range @ 5km [m]

44

Height range @ 10km [m]

-999

Height range @ 20km [m]

-999


Variance slope @ 1 km

32

Variance slope @ 2 km

31

Variance slope @ 5 km

34

Variance slope @ 10 km

-999

Variance slope @ 20 km

-999


NDVI (max. NDVI composite)


Roman et al. (2009) index


St

6.01327182015

Rcv

-0.0593477289968

Rse

0.0

Rst

0.107265563934

Rsv

-0.332283163063


NDVI range @ 1km [-]

0.02

NDVI range @ 2km [-]

0.11

NDVI range @ 5km [-]

0.16

NDVI range @ 10km [-]

0.15

NDVI range @ 20km [-]

0.15


Variance slope @ 1 km

0.000193813461033

Variance slope @ 2 km

0.000207501286399

Variance slope @ 5 km

0.000230968534051

Variance slope @ 10 km

0.000185798119134

Variance slope @ 20 km

8.34406653378e-05


NDVI (min. NDVI composite)I


Roman et al. (2009) index


St

2.13519194592

Rcv

0.483648331718

Rse

0.0

Rst

-0.155219014132

Rsv

0.766158560946


NDVI range @ 1km [-]

0.08

NDVI range @ 2km [-]

0.1

NDVI range @ 5km [-]

0.18

NDVI range @ 10km [-]

0.23

NDVI range @ 20km [-]

0.22


NDVI slope @ 1 km

0.000454934303546

NDVI slope @ 2 km

0.000493092553614

NDVI slope @ 5 km

0.000553086744829

NDVI slope @ 10 km

0.000467061484246

NDVI slope @ 20 km

0.000264523560972


Temporal stability analysis

+000 deg (BHR)


BHR statistics

Temporal stability [1/decade]:


abs

rel


Weighted least square:

None


Ordinary least square:

None


Probabilities that GCOS criteria is met:

Weighted least square:

None %

Ordinary least square:

None %


DHR statistics

Temporal stability [1/decade]:


abs

rel


Weighted least square:

None


Ordinary least square:

None


Probabilities that GCOS criteria is met:

Weighted least square:

None %

Ordinary least square:

None %


+057/+063 deg (BHR)


BHR statistics

Temporal stability [1/decade]:


abs

rel


Weighted least square:

None


Ordinary least square:

None


Probabilities that GCOS criteria is met:

Weighted least square:

None %

Ordinary least square:

None %


DHR statistics

Temporal stability [1/decade]:


abs

rel


Weighted least square:

None


Ordinary least square:

None


Probabilities that GCOS criteria is met:

Weighted least square:

None %

Ordinary least square:

None %


Temporal anomaly analyis

The variance of the temporal anomalies provides an additional measure about the stability of the signal AFTER removal of the mean seasonal cylce.

+000 deg


+057/+063 deg