RED_LAKE


Location

lon / lat [deg]: -114.051 / 35.684

Source network: AERONET


Geostationary surface albedo (GSA) data


“+000”


“+057/+063”


Landcover information (based on ESA CCI landcover data)


Landcover fractions @ 2km distance


Landcover fractions @ 20 km distance


Legend


Distance to open water bodies [km]:

1.51

Distance to urban areas [km]:

9.27


Radius: 1 km

Number of landcover classes:

1

Dominant landcover type:

120: Shrubland

Fraction of dominant landcover type [%]:

100.0


Radius: 2 km

Number of landcover classes:

2

Dominant landcover type:

120: Shrubland

Fraction of dominant landcover type [%]:

95.0


Radius: 5 km

Number of landcover classes:

4

Dominant landcover type:

120: Shrubland

Fraction of dominant landcover type [%]:

86.0


Radius: 10 km

Number of landcover classes:

3

Dominant landcover type:

120: Shrubland

Fraction of dominant landcover type [%]:

94.0


Radius: 20 km

Number of landcover classes:

3

Dominant landcover type:

120: Shrubland

Fraction of dominant landcover type [%]:

86.0


Disturbances


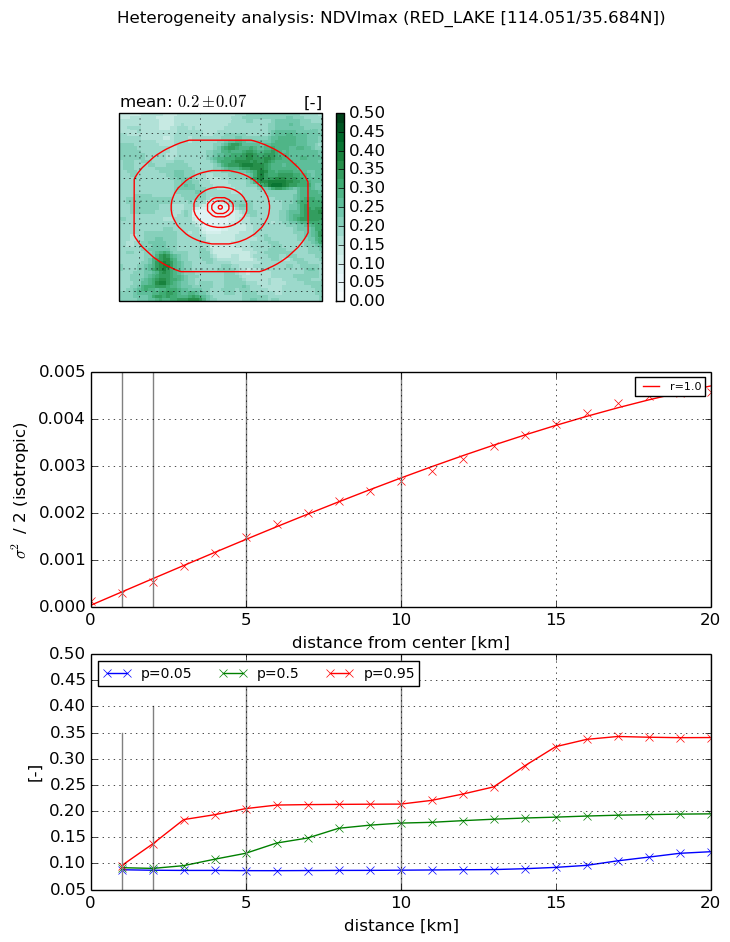
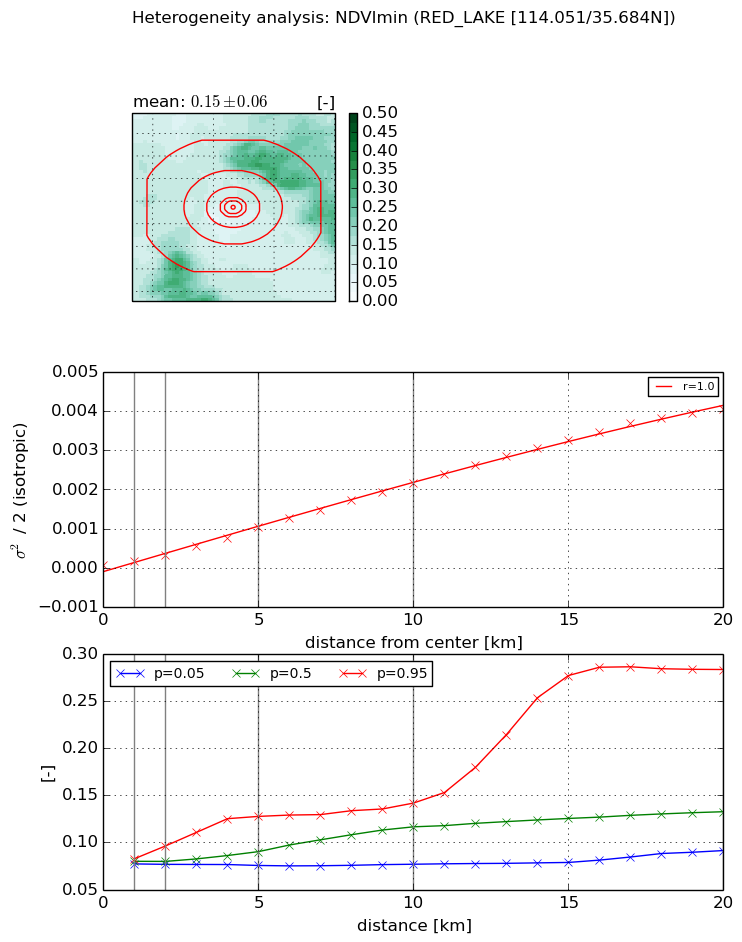
Heterogeneity analysis

The heterogeneity analysis provides information about the spatial and temporal heterogeneity of the site.

Topography


Roman et al. (2009) index


St

3.84113551754e-05

Rcv

5.21678848881

Rse

0.0

Rst

0.0359795159492

Rsv

78096.6518979


Height range @ 1km [m]

3

Height range @ 2km [m]

3

Height range @ 5km [m]

27

Height range @ 10km [m]

-999

Height range @ 20km [m]

-999


Variance slope @ 1 km

30

Variance slope @ 2 km

47

Variance slope @ 5 km

47

Variance slope @ 10 km

-999

Variance slope @ 20 km

-999


NDVI (max. NDVI composite)


Roman et al. (2009) index


St

3.75123017785

Rcv

0.166227300169

Rse

0.0

Rst

-0.0199778381746

Rsv

0.613532509779


NDVI range @ 1km [-]

0.01

NDVI range @ 2km [-]

0.05

NDVI range @ 5km [-]

0.12

NDVI range @ 10km [-]

0.13

NDVI range @ 20km [-]

0.22


Variance slope @ 1 km

0.000170638558638

Variance slope @ 2 km

0.000200379167247

Variance slope @ 5 km

0.000278595844932

Variance slope @ 10 km

0.000268713225348

Variance slope @ 20 km

0.000237290082262


NDVI (min. NDVI composite)I


Roman et al. (2009) index


St

1.68024226852

Rcv

0.471620966767

Rse

0.0

Rst

0.529520778909

Rsv

0.784315063855


NDVI range @ 1km [-]

0.01

NDVI range @ 2km [-]

0.02

NDVI range @ 5km [-]

0.05

NDVI range @ 10km [-]

0.06

NDVI range @ 20km [-]

0.19


NDVI slope @ 1 km

0.000101788712592

NDVI slope @ 2 km

0.000123574475362

NDVI slope @ 5 km

0.000196685845519

NDVI slope @ 10 km

0.000219303918585

NDVI slope @ 20 km

0.000213763433227


Temporal stability analysis

+000 deg (BHR)


BHR statistics

Temporal stability [1/decade]:


abs

rel


Weighted least square:

None


Ordinary least square:

None


Probabilities that GCOS criteria is met:

Weighted least square:

None %

Ordinary least square:

None %


DHR statistics

Temporal stability [1/decade]:


abs

rel


Weighted least square:

None


Ordinary least square:

None


Probabilities that GCOS criteria is met:

Weighted least square:

None %

Ordinary least square:

None %


+057/+063 deg (BHR)


BHR statistics

Temporal stability [1/decade]:


abs

rel


Weighted least square:

None


Ordinary least square:

None


Probabilities that GCOS criteria is met:

Weighted least square:

None %

Ordinary least square:

None %


DHR statistics

Temporal stability [1/decade]:


abs

rel


Weighted least square:

None


Ordinary least square:

None


Probabilities that GCOS criteria is met:

Weighted least square:

None %

Ordinary least square:

None %


Temporal anomaly analyis

The variance of the temporal anomalies provides an additional measure about the stability of the signal AFTER removal of the mean seasonal cylce.

+000 deg


+057/+063 deg