RED_MOUNTAIN_PASS


Location

lon / lat [deg]: -107.725 / 37.9083

Source network: AERONET


Geostationary surface albedo (GSA) data


“+000”


“+057/+063”


Landcover information (based on ESA CCI landcover data)


Landcover fractions @ 2km distance


Landcover fractions @ 20 km distance


Legend


Distance to open water bodies [km]:

2.96

Distance to urban areas [km]:

7.45


Radius: 1 km

Number of landcover classes:

3

Dominant landcover type:

130: grassland

Fraction of dominant landcover type [%]:

91.0


Radius: 2 km

Number of landcover classes:

3

Dominant landcover type:

130: grassland

Fraction of dominant landcover type [%]:

51.0


Radius: 5 km

Number of landcover classes:

4

Dominant landcover type:

130: grassland

Fraction of dominant landcover type [%]:

40.0


Radius: 10 km

Number of landcover classes:

4

Dominant landcover type:

70: Tree cover, needleleaved, evergreen, closed to open (>15%)

Fraction of dominant landcover type [%]:

46.0


Radius: 20 km

Number of landcover classes:

4

Dominant landcover type:

70: Tree cover, needleleaved, evergreen, closed to open (>15%)

Fraction of dominant landcover type [%]:

46.0


Disturbances


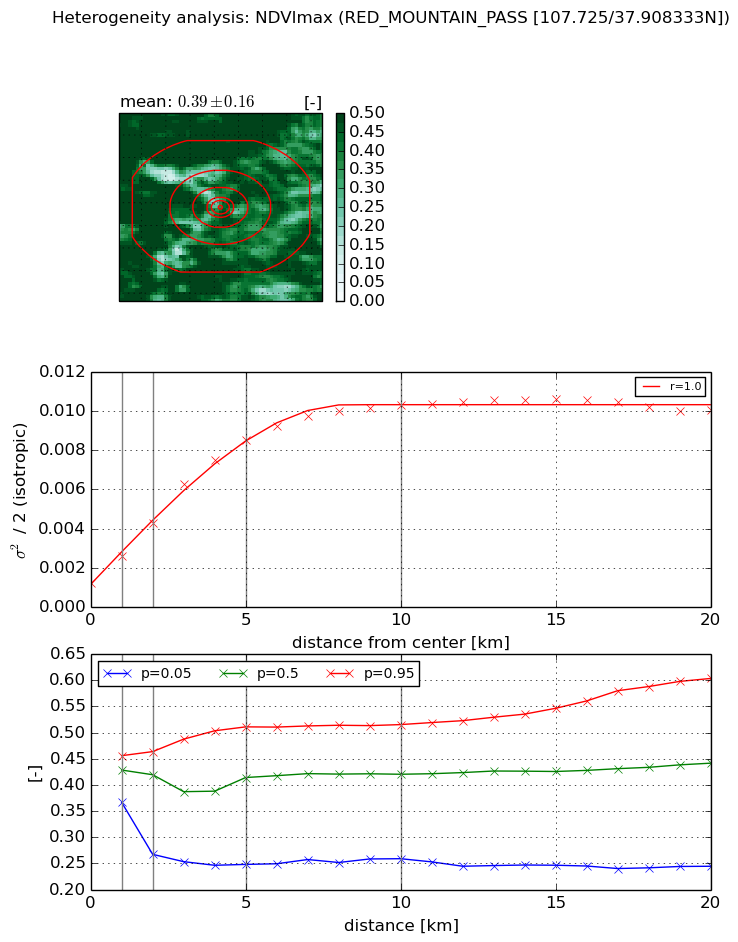
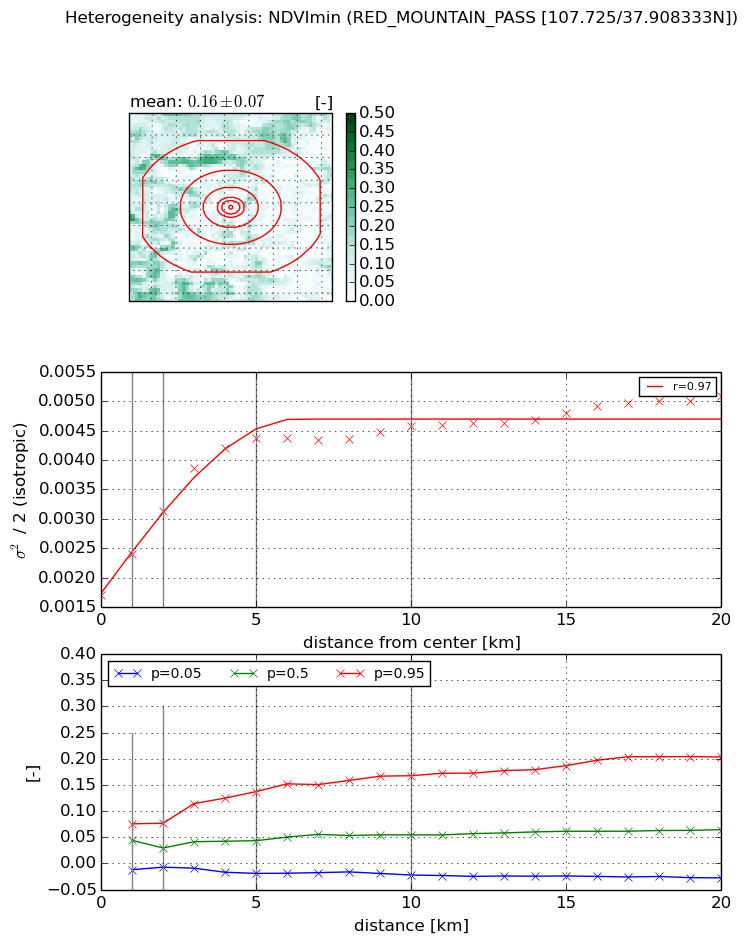
Heterogeneity analysis

The heterogeneity analysis provides information about the spatial and temporal heterogeneity of the site.

Topography


Roman et al. (2009) index


St

7.14222570168

Rcv

0.0661422935233

Rse

0.0

Rst

0.0274385147424

Rsv

-0.326456323758


Height range @ 1km [m]

441

Height range @ 2km [m]

645

Height range @ 5km [m]

804

Height range @ 10km [m]

-999

Height range @ 20km [m]

-999


Variance slope @ 1 km

25291

Variance slope @ 2 km

27265

Variance slope @ 5 km

15392

Variance slope @ 10 km

-999

Variance slope @ 20 km

-999


NDVI (max. NDVI composite)


Roman et al. (2009) index


St

17.6029695565

Rcv

0.0661009450534

Rse

0.0

Rst

0.0478896950654

Rsv

-0.0564351502784


NDVI range @ 1km [-]

0.09

NDVI range @ 2km [-]

0.2

NDVI range @ 5km [-]

0.26

NDVI range @ 10km [-]

0.26

NDVI range @ 20km [-]

0.36


Variance slope @ 1 km

0.00136881669155

Variance slope @ 2 km

0.00153054843778

Variance slope @ 5 km

0.00151895151836

Variance slope @ 10 km

0.000924383446551

Variance slope @ 20 km

0.000349408724876


NDVI (min. NDVI composite)I


Roman et al. (2009) index


St

nan

Rcv

nan

Rse

nan

Rst

nan

Rsv

nan


NDVI range @ 1km [-]

0.09

NDVI range @ 2km [-]

0.08

NDVI range @ 5km [-]

0.16

NDVI range @ 10km [-]

0.19

NDVI range @ 20km [-]

0.23


NDVI slope @ 1 km

0.000702287263762

NDVI slope @ 2 km

0.000714457354282

NDVI slope @ 5 km

0.000557229858116

NDVI slope @ 10 km

0.000249443138316

NDVI slope @ 20 km

0.000115837078336


Temporal stability analysis

+000 deg (BHR)


BHR statistics

Temporal stability [1/decade]:


abs

rel


Weighted least square:

None


Ordinary least square:

None


Probabilities that GCOS criteria is met:

Weighted least square:

None %

Ordinary least square:

None %


DHR statistics

Temporal stability [1/decade]:


abs

rel


Weighted least square:

None


Ordinary least square:

None


Probabilities that GCOS criteria is met:

Weighted least square:

None %

Ordinary least square:

None %


+057/+063 deg (BHR)


BHR statistics

Temporal stability [1/decade]:


abs

rel


Weighted least square:

None


Ordinary least square:

None


Probabilities that GCOS criteria is met:

Weighted least square:

None %

Ordinary least square:

None %


DHR statistics

Temporal stability [1/decade]:


abs

rel


Weighted least square:

None


Ordinary least square:

None


Probabilities that GCOS criteria is met:

Weighted least square:

None %

Ordinary least square:

None %


Temporal anomaly analyis

The variance of the temporal anomalies provides an additional measure about the stability of the signal AFTER removal of the mean seasonal cylce.

+000 deg


+057/+063 deg