REPRESSA_SAMUEL


Location

lon / lat [deg]: -63.4593 / -8.7552

Source network: AERONET


Geostationary surface albedo (GSA) data


“+000”


“+057/+063”


Landcover information (based on ESA CCI landcover data)


Landcover fractions @ 2km distance


Landcover fractions @ 20 km distance


Legend


Distance to open water bodies [km]:

0.58

Distance to urban areas [km]:

25.4


Radius: 1 km

Number of landcover classes:

2

Dominant landcover type:

50: Tree cover, broadleaved, evergreen, closed to open (>15%)

Fraction of dominant landcover type [%]:

82.0


Radius: 2 km

Number of landcover classes:

2

Dominant landcover type:

50: Tree cover, broadleaved, evergreen, closed to open (>15%)

Fraction of dominant landcover type [%]:

73.0


Radius: 5 km

Number of landcover classes:

4

Dominant landcover type:

50: Tree cover, broadleaved, evergreen, closed to open (>15%)

Fraction of dominant landcover type [%]:

55.0


Radius: 10 km

Number of landcover classes:

5

Dominant landcover type:

50: Tree cover, broadleaved, evergreen, closed to open (>15%)

Fraction of dominant landcover type [%]:

50.0


Radius: 20 km

Number of landcover classes:

6

Dominant landcover type:

50: Tree cover, broadleaved, evergreen, closed to open (>15%)

Fraction of dominant landcover type [%]:

62.0


Disturbances


Heterogeneity analysis

The heterogeneity analysis provides information about the spatial and temporal heterogeneity of the site.

Topography


Roman et al. (2009) index


St

1.66000164533

Rcv

1.32650822586

Rse

0.0

Rst

-0.0490552235012

Rsv

0.431663675046


Height range @ 1km [m]

0

Height range @ 2km [m]

1

Height range @ 5km [m]

4

Height range @ 10km [m]

-999

Height range @ 20km [m]

-999


Variance slope @ 1 km

0

Variance slope @ 2 km

1

Variance slope @ 5 km

1

Variance slope @ 10 km

-999

Variance slope @ 20 km

-999


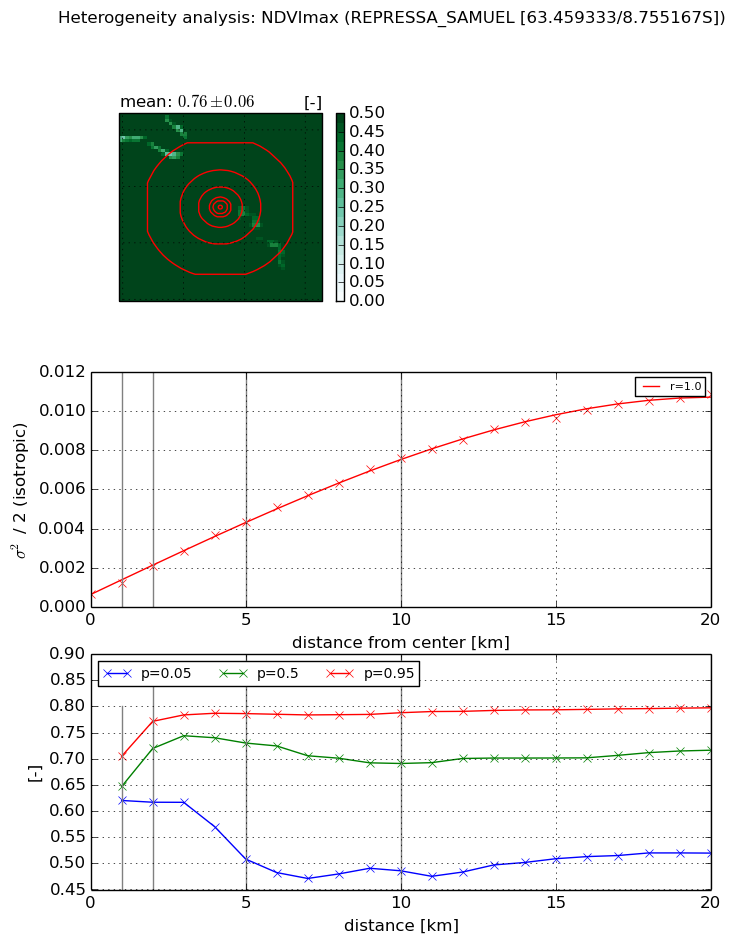
NDVI (max. NDVI composite)


Roman et al. (2009) index


St

1.56874650395

Rcv

0.850177195977

Rse

0.0

Rst

-0.062177714267

Rsv

-0.999999949156


NDVI range @ 1km [-]

0.08

NDVI range @ 2km [-]

0.15

NDVI range @ 5km [-]

0.28

NDVI range @ 10km [-]

0.3

NDVI range @ 20km [-]

0.28


Variance slope @ 1 km

0.000549207733318

Variance slope @ 2 km

0.000716457403701

Variance slope @ 5 km

0.000754061311479

Variance slope @ 10 km

0.000706387840457

Variance slope @ 20 km

0.000524393180688


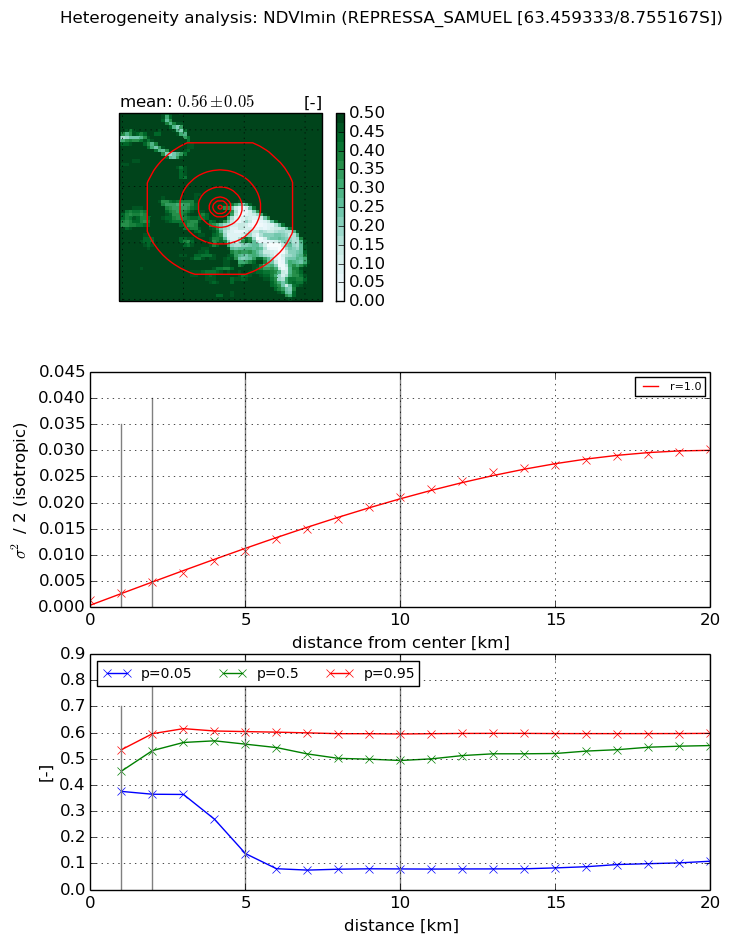
NDVI (min. NDVI composite)I


Roman et al. (2009) index


St

1.01204399208

Rcv

0.973115947039

Rse

0.0

Rst

-0.99118235344

Rsv

-0.999999717662


NDVI range @ 1km [-]

0.16

NDVI range @ 2km [-]

0.23

NDVI range @ 5km [-]

0.47

NDVI range @ 10km [-]

0.52

NDVI range @ 20km [-]

0.49


NDVI slope @ 1 km

0.0012362798869

NDVI slope @ 2 km

0.00166158940533

NDVI slope @ 5 km

0.00190761059737

NDVI slope @ 10 km

0.00201952677507

NDVI slope @ 20 km

0.00154325464463


Temporal stability analysis

+000 deg (BHR)


BHR statistics

Temporal stability [1/decade]:


abs

rel


Weighted least square:

-99999.0


Ordinary least square:

-99999.0


Probabilities that GCOS criteria is met:

Weighted least square:

-99999.0 %

Ordinary least square:

-99999.0 %


DHR statistics

Temporal stability [1/decade]:


abs

rel


Weighted least square:

-99999.0


Ordinary least square:

-99999.0


Probabilities that GCOS criteria is met:

Weighted least square:

-99999.0 %

Ordinary least square:

-99999.0 %


+057/+063 deg (BHR)


BHR statistics

Temporal stability [1/decade]:


abs

rel


Weighted least square:

None


Ordinary least square:

None


Probabilities that GCOS criteria is met:

Weighted least square:

None %

Ordinary least square:

None %


DHR statistics

Temporal stability [1/decade]:


abs

rel


Weighted least square:

None


Ordinary least square:

None


Probabilities that GCOS criteria is met:

Weighted least square:

None %

Ordinary least square:

None %


Temporal anomaly analyis

The variance of the temporal anomalies provides an additional measure about the stability of the signal AFTER removal of the mean seasonal cylce.

+000 deg


+057/+063 deg