RICHLAND


Location

lon / lat [deg]: -119.28 / 46.34

Source network: AERONET


Geostationary surface albedo (GSA) data


“+000”


“+057/+063”


Landcover information (based on ESA CCI landcover data)


Landcover fractions @ 2km distance


Landcover fractions @ 20 km distance


Legend


Distance to open water bodies [km]:

1.31

Distance to urban areas [km]:

0.07


Radius: 1 km

Number of landcover classes:

1

Dominant landcover type:

190: urban areas

Fraction of dominant landcover type [%]:

100.0


Radius: 2 km

Number of landcover classes:

4

Dominant landcover type:

190: urban areas

Fraction of dominant landcover type [%]:

74.0


Radius: 5 km

Number of landcover classes:

5

Dominant landcover type:

190: urban areas

Fraction of dominant landcover type [%]:

38.0


Radius: 10 km

Number of landcover classes:

6

Dominant landcover type:

10: cropland, rainfed

Fraction of dominant landcover type [%]:

34.0


Radius: 20 km

Number of landcover classes:

5

Dominant landcover type:

10: cropland, rainfed

Fraction of dominant landcover type [%]:

34.0


Disturbances


Heterogeneity analysis

The heterogeneity analysis provides information about the spatial and temporal heterogeneity of the site.

Topography


Roman et al. (2009) index


St

7.43909180327e-05

Rcv

0.561636414663

Rse

0.0

Rst

-0.0266584291915

Rsv

40326.9151066


Height range @ 1km [m]

9

Height range @ 2km [m]

19

Height range @ 5km [m]

48

Height range @ 10km [m]

-999

Height range @ 20km [m]

-999


Variance slope @ 1 km

157

Variance slope @ 2 km

165

Variance slope @ 5 km

122

Variance slope @ 10 km

-999

Variance slope @ 20 km

-999


NDVI (max. NDVI composite)


Roman et al. (2009) index


St

2.00130968681

Rcv

0.161308969483

Rse

0.0

Rst

-0.190409482528

Rsv

1.14729992569


NDVI range @ 1km [-]

0.06

NDVI range @ 2km [-]

0.17

NDVI range @ 5km [-]

0.37

NDVI range @ 10km [-]

0.38

NDVI range @ 20km [-]

0.41


Variance slope @ 1 km

0.000919631072756

Variance slope @ 2 km

0.00126346584705

Variance slope @ 5 km

0.00140111426226

Variance slope @ 10 km

0.00143878319572

Variance slope @ 20 km

0.00138531430641


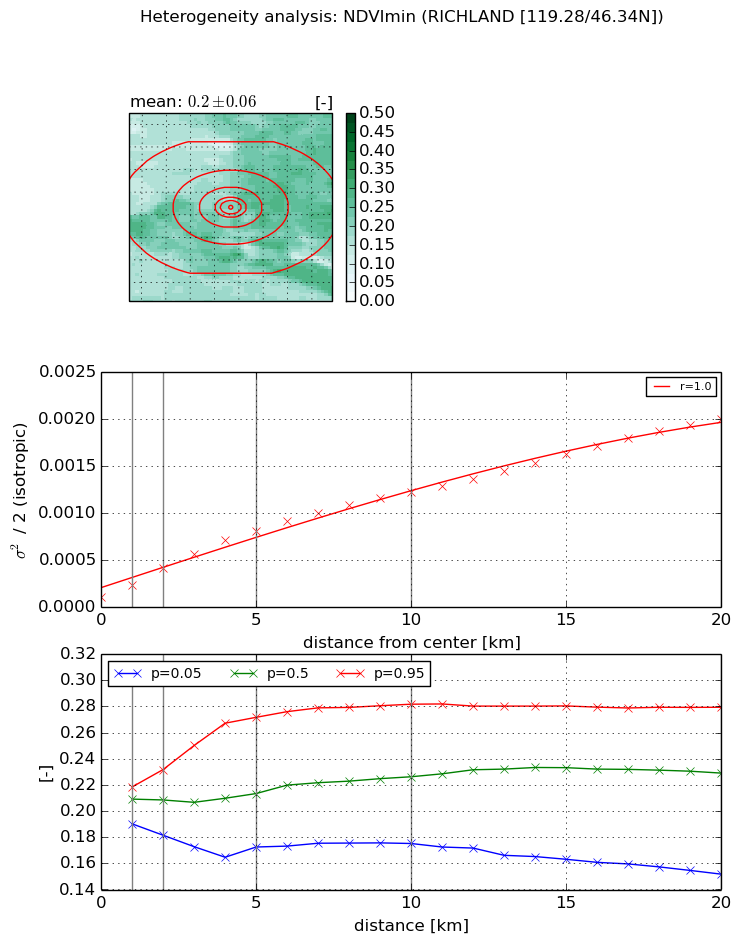
NDVI (min. NDVI composite)I


Roman et al. (2009) index


St

9.51188105288e-08

Rcv

0.246758993004

Rse

0.0

Rst

-0.0269281262274

Rsv

31539502.6209


NDVI range @ 1km [-]

0.03

NDVI range @ 2km [-]

0.05

NDVI range @ 5km [-]

0.1

NDVI range @ 10km [-]

0.11

NDVI range @ 20km [-]

0.13


NDVI slope @ 1 km

0.00012078847807

NDVI slope @ 2 km

0.000154658899999

NDVI slope @ 5 km

0.000144904530131

NDVI slope @ 10 km

0.000112410812036

NDVI slope @ 20 km

8.95427887026e-05


Temporal stability analysis

+000 deg (BHR)


BHR statistics

Temporal stability [1/decade]:


abs

rel


Weighted least square:

None


Ordinary least square:

None


Probabilities that GCOS criteria is met:

Weighted least square:

None %

Ordinary least square:

None %


DHR statistics

Temporal stability [1/decade]:


abs

rel


Weighted least square:

None


Ordinary least square:

None


Probabilities that GCOS criteria is met:

Weighted least square:

None %

Ordinary least square:

None %


+057/+063 deg (BHR)


BHR statistics

Temporal stability [1/decade]:


abs

rel


Weighted least square:

None


Ordinary least square:

None


Probabilities that GCOS criteria is met:

Weighted least square:

None %

Ordinary least square:

None %


DHR statistics

Temporal stability [1/decade]:


abs

rel


Weighted least square:

None


Ordinary least square:

None


Probabilities that GCOS criteria is met:

Weighted least square:

None %

Ordinary least square:

None %


Temporal anomaly analyis

The variance of the temporal anomalies provides an additional measure about the stability of the signal AFTER removal of the mean seasonal cylce.

+000 deg


+057/+063 deg