RIO_BRANCO


Location

lon / lat [deg]: -67.8694 / -9.9575

Source network: AERONET


Geostationary surface albedo (GSA) data


“+000”


“+057/+063”


Landcover information (based on ESA CCI landcover data)


Landcover fractions @ 2km distance


Landcover fractions @ 20 km distance


Legend


Distance to open water bodies [km]:

8.82

Distance to urban areas [km]:

0.15


Radius: 1 km

Number of landcover classes:

5

Dominant landcover type:

190: urban areas

Fraction of dominant landcover type [%]:

42.0


Radius: 2 km

Number of landcover classes:

6

Dominant landcover type:

190: urban areas

Fraction of dominant landcover type [%]:

65.0


Radius: 5 km

Number of landcover classes:

6

Dominant landcover type:

190: urban areas

Fraction of dominant landcover type [%]:

43.0


Radius: 10 km

Number of landcover classes:

8

Dominant landcover type:

50: Tree cover, broadleaved, evergreen, closed to open (>15%)

Fraction of dominant landcover type [%]:

40.0


Radius: 20 km

Number of landcover classes:

7

Dominant landcover type:

50: Tree cover, broadleaved, evergreen, closed to open (>15%)

Fraction of dominant landcover type [%]:

54.0


Disturbances


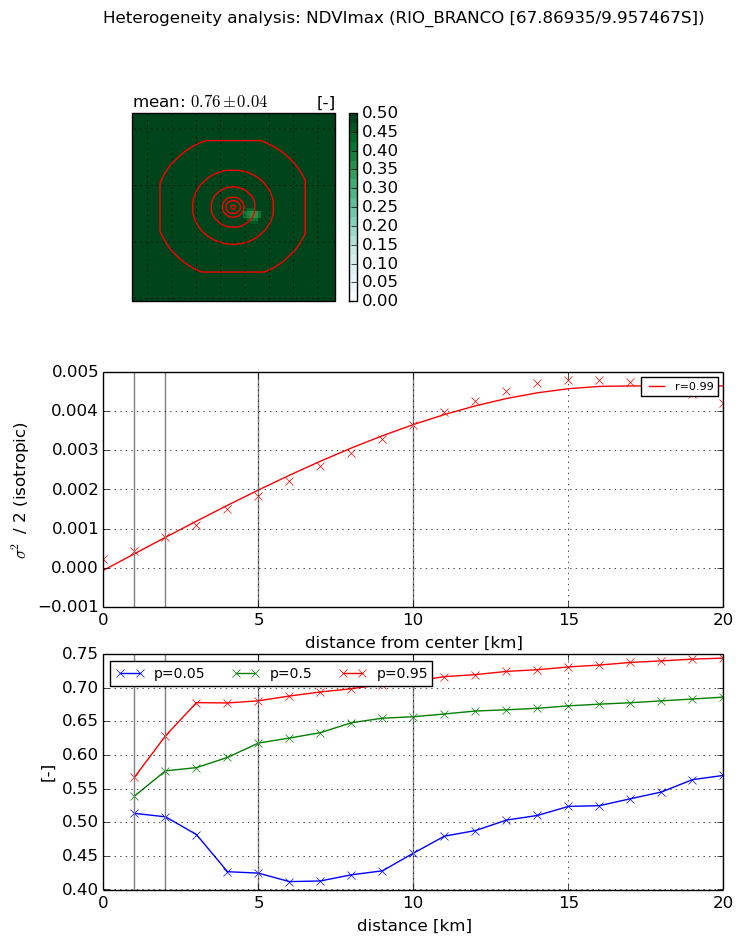
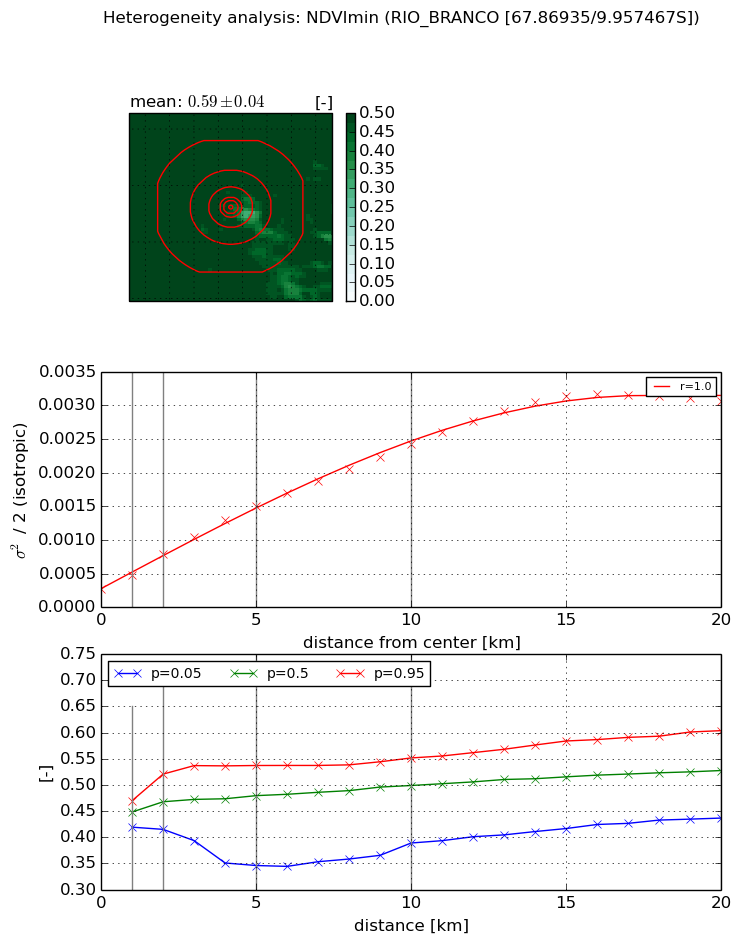
Heterogeneity analysis

The heterogeneity analysis provides information about the spatial and temporal heterogeneity of the site.

Topography


Roman et al. (2009) index


St

1.68772691644

Rcv

0.736748897158

Rse

0.0

Rst

-0.0419456774735

Rsv

-0.998844179285


Height range @ 1km [m]

5

Height range @ 2km [m]

11

Height range @ 5km [m]

29

Height range @ 10km [m]

-999

Height range @ 20km [m]

-999


Variance slope @ 1 km

6

Variance slope @ 2 km

12

Variance slope @ 5 km

23

Variance slope @ 10 km

-999

Variance slope @ 20 km

-999


NDVI (max. NDVI composite)


Roman et al. (2009) index


St

0.602917081388

Rcv

0.420701767702

Rse

0.0

Rst

9.66587135286e-09

Rsv

4.55510682486


NDVI range @ 1km [-]

0.05

NDVI range @ 2km [-]

0.12

NDVI range @ 5km [-]

0.26

NDVI range @ 10km [-]

0.26

NDVI range @ 20km [-]

0.17


Variance slope @ 1 km

0.000201435941851

Variance slope @ 2 km

0.000273255689565

Variance slope @ 5 km

0.00033033702111

Variance slope @ 10 km

0.000351627609487

Variance slope @ 20 km

0.00024114090709


NDVI (min. NDVI composite)I


Roman et al. (2009) index


St

2.32388744345

Rcv

0.295783740908

Rse

0.0

Rst

-8.5109111424e-09

Rsv

0.995156570627


NDVI range @ 1km [-]

0.05

NDVI range @ 2km [-]

0.11

NDVI range @ 5km [-]

0.19

NDVI range @ 10km [-]

0.16

NDVI range @ 20km [-]

0.17


NDVI slope @ 1 km

0.00021025920513

NDVI slope @ 2 km

0.000263833815474

NDVI slope @ 5 km

0.00025312586711

NDVI slope @ 10 km

0.000214999291565

NDVI slope @ 20 km

0.000149504650413


Temporal stability analysis

+000 deg (BHR)


BHR statistics

Temporal stability [1/decade]:


abs

rel


Weighted least square:

-99999.0


Ordinary least square:

-99999.0


Probabilities that GCOS criteria is met:

Weighted least square:

-99999.0 %

Ordinary least square:

-99999.0 %


DHR statistics

Temporal stability [1/decade]:


abs

rel


Weighted least square:

-99999.0


Ordinary least square:

-99999.0


Probabilities that GCOS criteria is met:

Weighted least square:

-99999.0 %

Ordinary least square:

-99999.0 %


+057/+063 deg (BHR)


BHR statistics

Temporal stability [1/decade]:


abs

rel


Weighted least square:

None


Ordinary least square:

None


Probabilities that GCOS criteria is met:

Weighted least square:

None %

Ordinary least square:

None %


DHR statistics

Temporal stability [1/decade]:


abs

rel


Weighted least square:

None


Ordinary least square:

None


Probabilities that GCOS criteria is met:

Weighted least square:

None %

Ordinary least square:

None %


Temporal anomaly analyis

The variance of the temporal anomalies provides an additional measure about the stability of the signal AFTER removal of the mean seasonal cylce.

+000 deg


+057/+063 deg