ROCHESTER


Location

lon / lat [deg]: -77.5864 / 44.2337

Source network: AERONET


Geostationary surface albedo (GSA) data


“+000”


“+057/+063”


Landcover information (based on ESA CCI landcover data)


Landcover fractions @ 2km distance


Landcover fractions @ 20 km distance


Legend


Distance to open water bodies [km]:

0.14

Distance to urban areas [km]:

2.78


Radius: 1 km

Number of landcover classes:

5

Dominant landcover type:

210: water bodies

Fraction of dominant landcover type [%]:

54.0


Radius: 2 km

Number of landcover classes:

8

Dominant landcover type:

62: Tree cover, broadleaved, decidous (open 15-40%)

Fraction of dominant landcover type [%]:

37.0


Radius: 5 km

Number of landcover classes:

8

Dominant landcover type:

62: Tree cover, broadleaved, decidous (open 15-40%)

Fraction of dominant landcover type [%]:

33.0


Radius: 10 km

Number of landcover classes:

7

Dominant landcover type:

130: grassland

Fraction of dominant landcover type [%]:

41.0


Radius: 20 km

Number of landcover classes:

8

Dominant landcover type:

130: grassland

Fraction of dominant landcover type [%]:

42.0


Disturbances


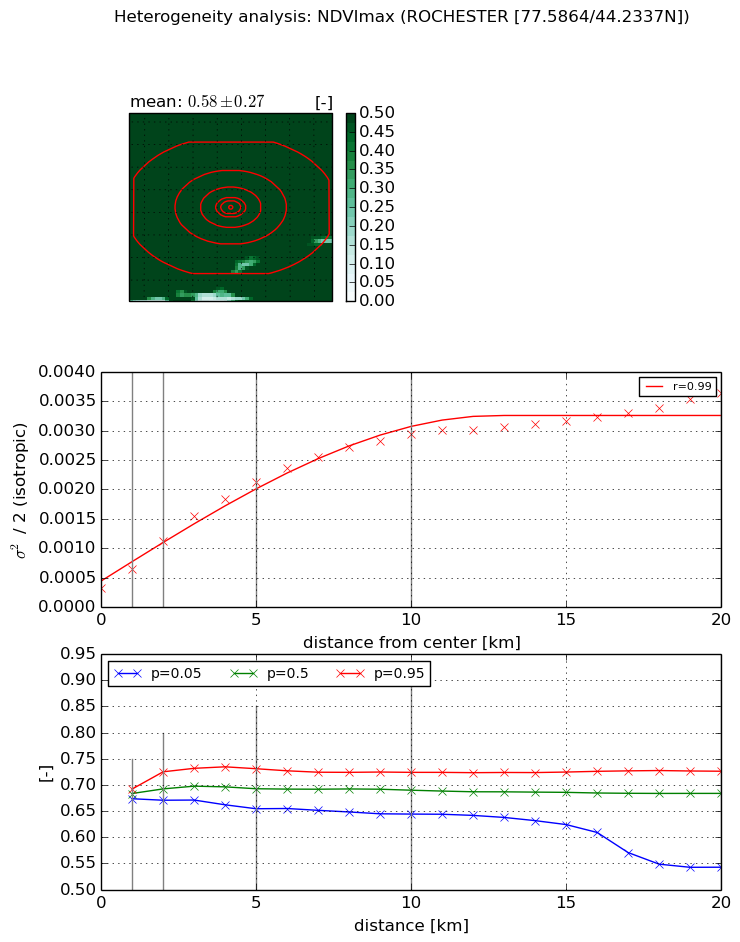
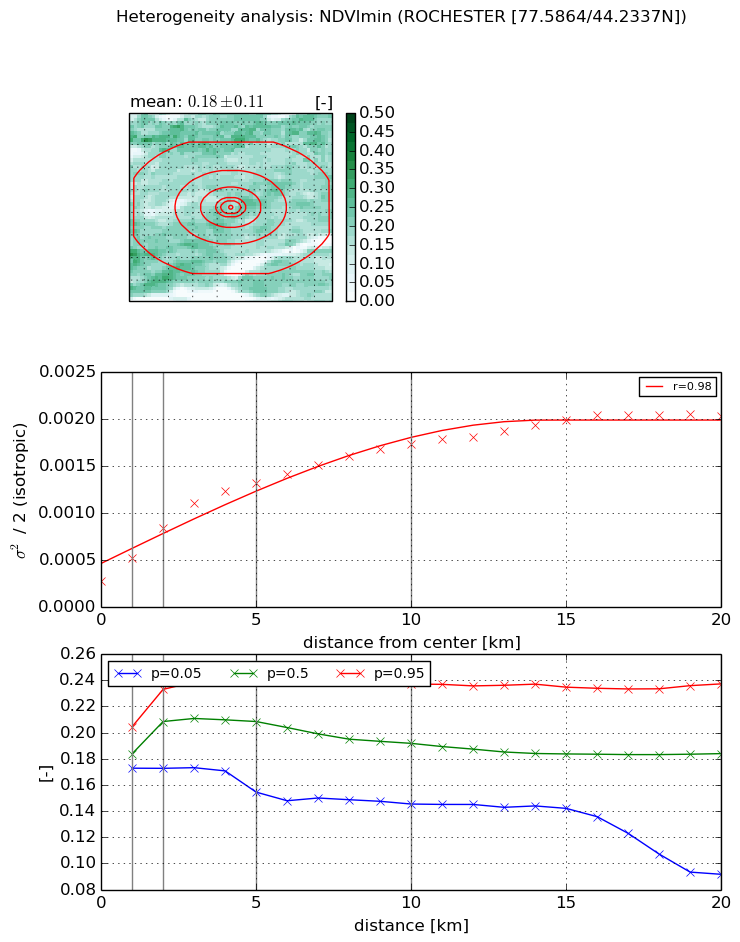
Heterogeneity analysis

The heterogeneity analysis provides information about the spatial and temporal heterogeneity of the site.

Topography


Roman et al. (2009) index


St

5.90216895048

Rcv

-0.0130166437567

Rse

0.0

Rst

-0.0302685543974

Rsv

0.465002522033


Height range @ 1km [m]

83

Height range @ 2km [m]

93

Height range @ 5km [m]

90

Height range @ 10km [m]

-999

Height range @ 20km [m]

-999


Variance slope @ 1 km

389

Variance slope @ 2 km

418

Variance slope @ 5 km

178

Variance slope @ 10 km

-999

Variance slope @ 20 km

-999


NDVI (max. NDVI composite)


Roman et al. (2009) index


St

6.74181017582

Rcv

0.167107192273

Rse

0.0

Rst

-0.0704531656541

Rsv

0.207423989267


NDVI range @ 1km [-]

0.02

NDVI range @ 2km [-]

0.05

NDVI range @ 5km [-]

0.08

NDVI range @ 10km [-]

0.08

NDVI range @ 20km [-]

0.18


Variance slope @ 1 km

0.000332254975907

Variance slope @ 2 km

0.000401475418021

Variance slope @ 5 km

0.000371927841731

Variance slope @ 10 km

0.000265407263814

Variance slope @ 20 km

0.0001407306236


NDVI (min. NDVI composite)I


Roman et al. (2009) index


St

1.31565183954

Rcv

0.422336377938

Rse

0.0

Rst

-0.390650333677

Rsv

1.46725180577


NDVI range @ 1km [-]

0.03

NDVI range @ 2km [-]

0.06

NDVI range @ 5km [-]

0.09

NDVI range @ 10km [-]

0.09

NDVI range @ 20km [-]

0.15


NDVI slope @ 1 km

0.000239699418456

NDVI slope @ 2 km

0.000283070317343

NDVI slope @ 5 km

0.000218218864735

NDVI slope @ 10 km

0.000138314993945

NDVI slope @ 20 km

7.70709582878e-05


Temporal stability analysis

+000 deg (BHR)


BHR statistics

Temporal stability [1/decade]:


abs

rel


Weighted least square:

-99999.0


Ordinary least square:

-99999.0


Probabilities that GCOS criteria is met:

Weighted least square:

-99999.0 %

Ordinary least square:

-99999.0 %


DHR statistics

Temporal stability [1/decade]:


abs

rel


Weighted least square:

-99999.0


Ordinary least square:

-99999.0


Probabilities that GCOS criteria is met:

Weighted least square:

-99999.0 %

Ordinary least square:

-99999.0 %


+057/+063 deg (BHR)


BHR statistics

Temporal stability [1/decade]:


abs

rel


Weighted least square:

None


Ordinary least square:

None


Probabilities that GCOS criteria is met:

Weighted least square:

None %

Ordinary least square:

None %


DHR statistics

Temporal stability [1/decade]:


abs

rel


Weighted least square:

None


Ordinary least square:

None


Probabilities that GCOS criteria is met:

Weighted least square:

None %

Ordinary least square:

None %


Temporal anomaly analyis

The variance of the temporal anomalies provides an additional measure about the stability of the signal AFTER removal of the mean seasonal cylce.

+000 deg


+057/+063 deg