ROCKVILLE


Location

lon / lat [deg]: -77.1296 / 39.0561

Source network: AERONET


Geostationary surface albedo (GSA) data


“+000”


“+057/+063”


Landcover information (based on ESA CCI landcover data)


Landcover fractions @ 2km distance


Landcover fractions @ 20 km distance


Legend


Distance to open water bodies [km]:

5.5

Distance to urban areas [km]:

0.1


Radius: 1 km

Number of landcover classes:

1

Dominant landcover type:

190: urban areas

Fraction of dominant landcover type [%]:

100.0


Radius: 2 km

Number of landcover classes:

2

Dominant landcover type:

190: urban areas

Fraction of dominant landcover type [%]:

97.0


Radius: 5 km

Number of landcover classes:

1

Dominant landcover type:

190: urban areas

Fraction of dominant landcover type [%]:

99.0


Radius: 10 km

Number of landcover classes:

4

Dominant landcover type:

190: urban areas

Fraction of dominant landcover type [%]:

85.0


Radius: 20 km

Number of landcover classes:

5

Dominant landcover type:

190: urban areas

Fraction of dominant landcover type [%]:

62.0


Disturbances


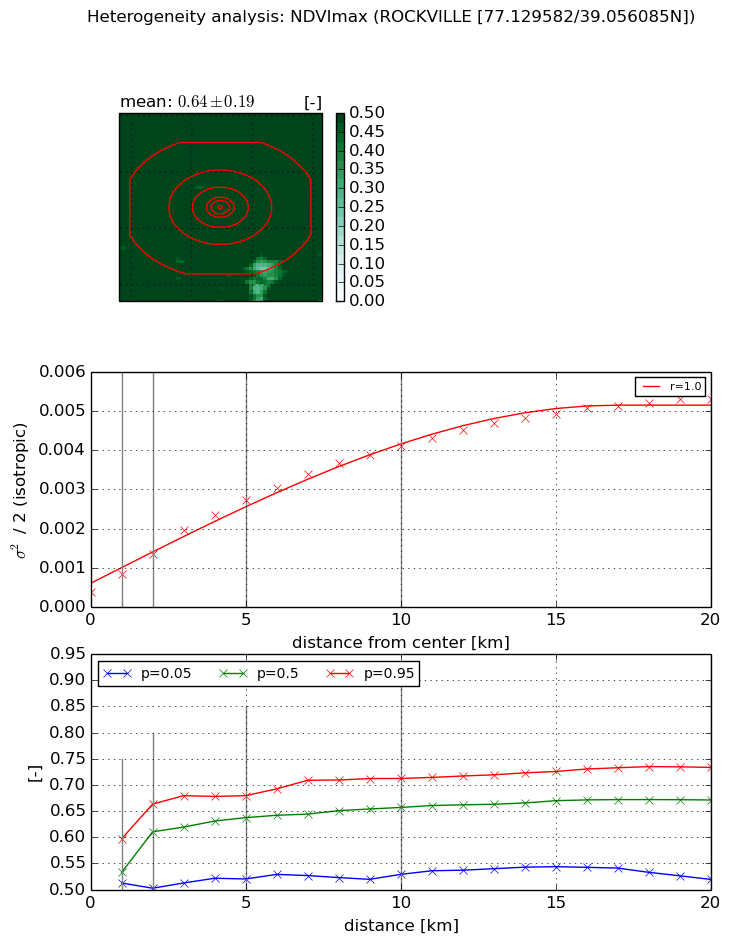
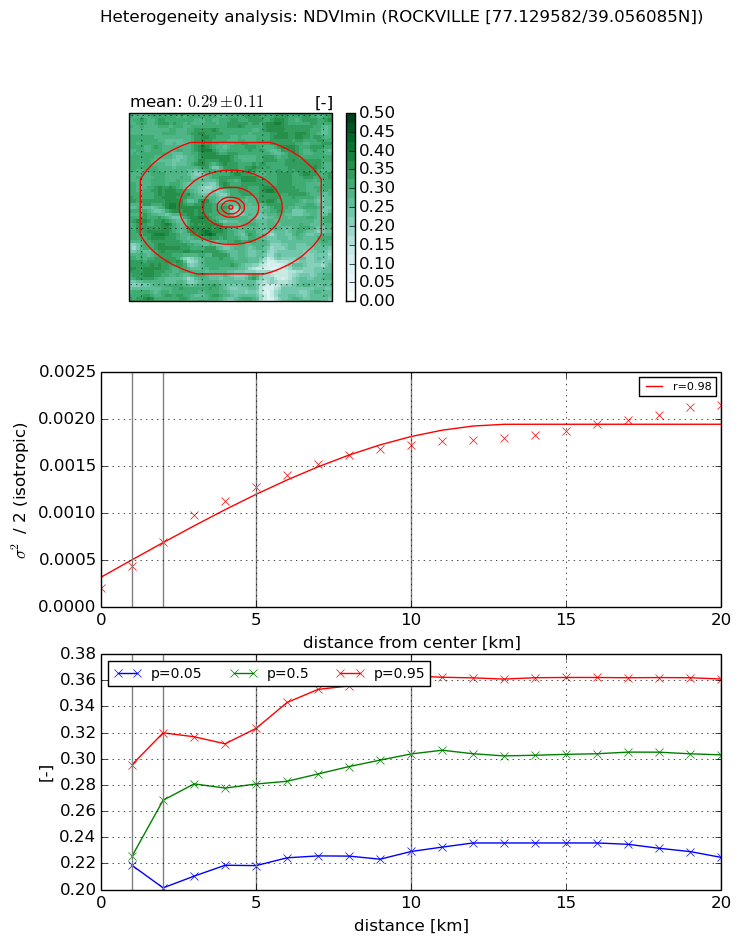
Heterogeneity analysis

The heterogeneity analysis provides information about the spatial and temporal heterogeneity of the site.

Topography


Roman et al. (2009) index


St

4.31176019799

Rcv

0.29524095633

Rse

0.0

Rst

-0.0404094133719

Rsv

0.360121162629


Height range @ 1km [m]

20

Height range @ 2km [m]

28

Height range @ 5km [m]

49

Height range @ 10km [m]

-999

Height range @ 20km [m]

-999


Variance slope @ 1 km

84

Variance slope @ 2 km

71

Variance slope @ 5 km

38

Variance slope @ 10 km

-999

Variance slope @ 20 km

-999


NDVI (max. NDVI composite)


Roman et al. (2009) index


St

6.07129960256

Rcv

-0.192416538329

Rse

0.0

Rst

-0.0938449394623

Rsv

0.207866665504


NDVI range @ 1km [-]

0.08

NDVI range @ 2km [-]

0.16

NDVI range @ 5km [-]

0.16

NDVI range @ 10km [-]

0.18

NDVI range @ 20km [-]

0.21


Variance slope @ 1 km

0.000459429690444

Variance slope @ 2 km

0.000482778841707

Variance slope @ 5 km

0.000480855289236

Variance slope @ 10 km

0.000374159490404

Variance slope @ 20 km

0.000237012373011


NDVI (min. NDVI composite)I


Roman et al. (2009) index


St

1.26847196314

Rcv

-0.175128811336

Rse

0.0

Rst

-0.865441537614

Rsv

1.32447995344


NDVI range @ 1km [-]

0.08

NDVI range @ 2km [-]

0.12

NDVI range @ 5km [-]

0.1

NDVI range @ 10km [-]

0.13

NDVI range @ 20km [-]

0.14


NDVI slope @ 1 km

0.00022881935373

NDVI slope @ 2 km

0.000239987487153

NDVI slope @ 5 km

0.000220018842987

NDVI slope @ 10 km

0.00015201509521

NDVI slope @ 20 km

8.23015155163e-05


Temporal stability analysis

+000 deg (BHR)


BHR statistics

Temporal stability [1/decade]:


abs

rel


Weighted least square:

-99999.0


Ordinary least square:

-99999.0


Probabilities that GCOS criteria is met:

Weighted least square:

-99999.0 %

Ordinary least square:

-99999.0 %


DHR statistics

Temporal stability [1/decade]:


abs

rel


Weighted least square:

-99999.0


Ordinary least square:

-99999.0


Probabilities that GCOS criteria is met:

Weighted least square:

-99999.0 %

Ordinary least square:

-99999.0 %


+057/+063 deg (BHR)


BHR statistics

Temporal stability [1/decade]:


abs

rel


Weighted least square:

None


Ordinary least square:

None


Probabilities that GCOS criteria is met:

Weighted least square:

None %

Ordinary least square:

None %


DHR statistics

Temporal stability [1/decade]:


abs

rel


Weighted least square:

None


Ordinary least square:

None


Probabilities that GCOS criteria is met:

Weighted least square:

None %

Ordinary least square:

None %


Temporal anomaly analyis

The variance of the temporal anomalies provides an additional measure about the stability of the signal AFTER removal of the mean seasonal cylce.

+000 deg


+057/+063 deg