ROGERS_DRY_LAKE


Location

lon / lat [deg]: -117.885 / 34.9256

Source network: AERONET


Geostationary surface albedo (GSA) data


“+000”


“+057/+063”


Landcover information (based on ESA CCI landcover data)


Landcover fractions @ 2km distance


Landcover fractions @ 20 km distance


Legend


Distance to open water bodies [km]:

1.73

Distance to urban areas [km]:

0.46


Radius: 1 km

Number of landcover classes:

3

Dominant landcover type:

120: Shrubland

Fraction of dominant landcover type [%]:

59.0


Radius: 2 km

Number of landcover classes:

4

Dominant landcover type:

120: Shrubland

Fraction of dominant landcover type [%]:

54.0


Radius: 5 km

Number of landcover classes:

4

Dominant landcover type:

120: Shrubland

Fraction of dominant landcover type [%]:

49.0


Radius: 10 km

Number of landcover classes:

4

Dominant landcover type:

120: Shrubland

Fraction of dominant landcover type [%]:

53.0


Radius: 20 km

Number of landcover classes:

4

Dominant landcover type:

120: Shrubland

Fraction of dominant landcover type [%]:

84.0


Disturbances


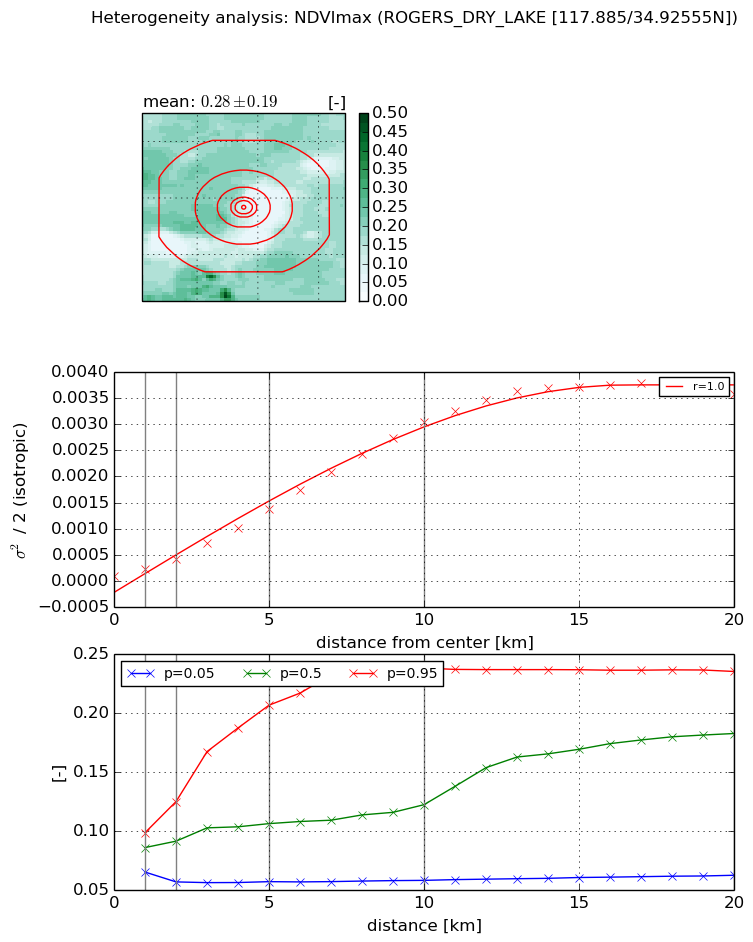
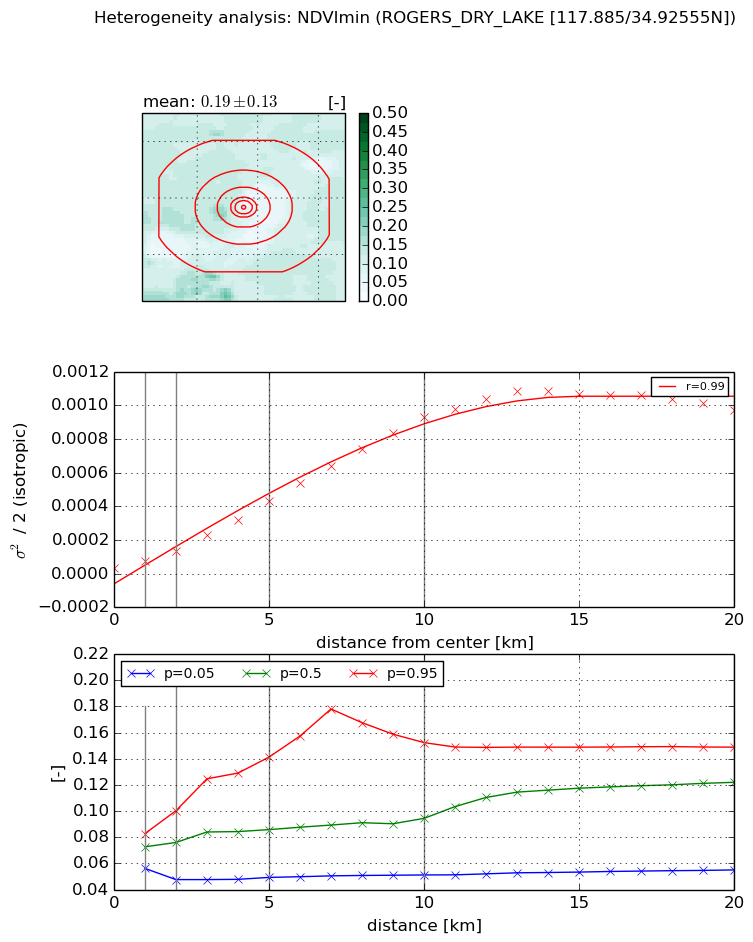
Heterogeneity analysis

The heterogeneity analysis provides information about the spatial and temporal heterogeneity of the site.

Topography


Roman et al. (2009) index


St

1.7608550257

Rcv

0.59576920851

Rse

0.0

Rst

-4.89251077207e-06

Rsv

1.1079436703


Height range @ 1km [m]

15

Height range @ 2km [m]

24

Height range @ 5km [m]

57

Height range @ 10km [m]

-999

Height range @ 20km [m]

-999


Variance slope @ 1 km

46

Variance slope @ 2 km

65

Variance slope @ 5 km

73

Variance slope @ 10 km

-999

Variance slope @ 20 km

-999


NDVI (max. NDVI composite)


Roman et al. (2009) index


St

1.46148667663

Rcv

0.300558729228

Rse

0.0

Rst

1.44650978708e-09

Rsv

1.75214557923


NDVI range @ 1km [-]

0.03

NDVI range @ 2km [-]

0.07

NDVI range @ 5km [-]

0.15

NDVI range @ 10km [-]

0.18

NDVI range @ 20km [-]

0.17


Variance slope @ 1 km

0.000133257367077

Variance slope @ 2 km

0.000161785318652

Variance slope @ 5 km

0.000259784583035

Variance slope @ 10 km

0.000311086717075

Variance slope @ 20 km

0.000204239179304


NDVI (min. NDVI composite)I


Roman et al. (2009) index


St

11.8984432039

Rcv

0.238706340051

Rse

0.0

Rst

-8.10245059294e-09

Rsv

-0.0134274771371


NDVI range @ 1km [-]

0.03

NDVI range @ 2km [-]

0.05

NDVI range @ 5km [-]

0.09

NDVI range @ 10km [-]

0.1

NDVI range @ 20km [-]

0.09


NDVI slope @ 1 km

4.4620783247e-05

NDVI slope @ 2 km

5.23644583207e-05

NDVI slope @ 5 km

8.03097096421e-05

NDVI slope @ 10 km

9.44494182738e-05

NDVI slope @ 20 km

5.56005453139e-05


Temporal stability analysis

+000 deg (BHR)


BHR statistics

Temporal stability [1/decade]:


abs

rel


Weighted least square:

None


Ordinary least square:

None


Probabilities that GCOS criteria is met:

Weighted least square:

None %

Ordinary least square:

None %


DHR statistics

Temporal stability [1/decade]:


abs

rel


Weighted least square:

None


Ordinary least square:

None


Probabilities that GCOS criteria is met:

Weighted least square:

None %

Ordinary least square:

None %


+057/+063 deg (BHR)


BHR statistics

Temporal stability [1/decade]:


abs

rel


Weighted least square:

None


Ordinary least square:

None


Probabilities that GCOS criteria is met:

Weighted least square:

None %

Ordinary least square:

None %


DHR statistics

Temporal stability [1/decade]:


abs

rel


Weighted least square:

None


Ordinary least square:

None


Probabilities that GCOS criteria is met:

Weighted least square:

None %

Ordinary least square:

None %


Temporal anomaly analyis

The variance of the temporal anomalies provides an additional measure about the stability of the signal AFTER removal of the mean seasonal cylce.

+000 deg


+057/+063 deg