RU-COK


Location

lon / lat [deg]: 147.883 / 70.6167

Source network: FLUXNET


Geostationary surface albedo (GSA) data


“+000”


“+057/+063”


Landcover information (based on ESA CCI landcover data)


Landcover fractions @ 2km distance


Landcover fractions @ 20 km distance


Legend


Distance to open water bodies [km]:

0.47

Distance to urban areas [km]:

none in region


Radius: 1 km

Number of landcover classes:

4

Dominant landcover type:

180: shrub or herbaceous cover, flooded, fresh/saline/brakish water

Fraction of dominant landcover type [%]:

51.0


Radius: 2 km

Number of landcover classes:

4

Dominant landcover type:

180: shrub or herbaceous cover, flooded, fresh/saline/brakish water

Fraction of dominant landcover type [%]:

44.0


Radius: 5 km

Number of landcover classes:

5

Dominant landcover type:

150: Sparse vegetation (tree, shrub, herbaceous cover) (<15%)

Fraction of dominant landcover type [%]:

60.0


Radius: 10 km

Number of landcover classes:

4

Dominant landcover type:

150: Sparse vegetation (tree, shrub, herbaceous cover) (<15%)

Fraction of dominant landcover type [%]:

70.0


Radius: 20 km

Number of landcover classes:

4

Dominant landcover type:

150: Sparse vegetation (tree, shrub, herbaceous cover) (<15%)

Fraction of dominant landcover type [%]:

72.0


Disturbances


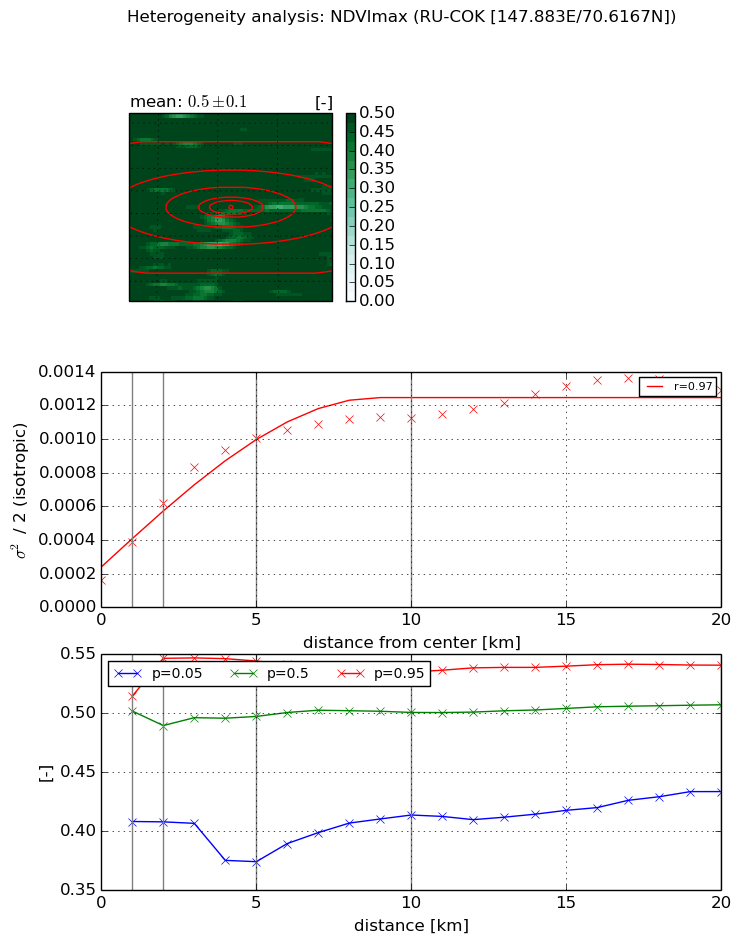
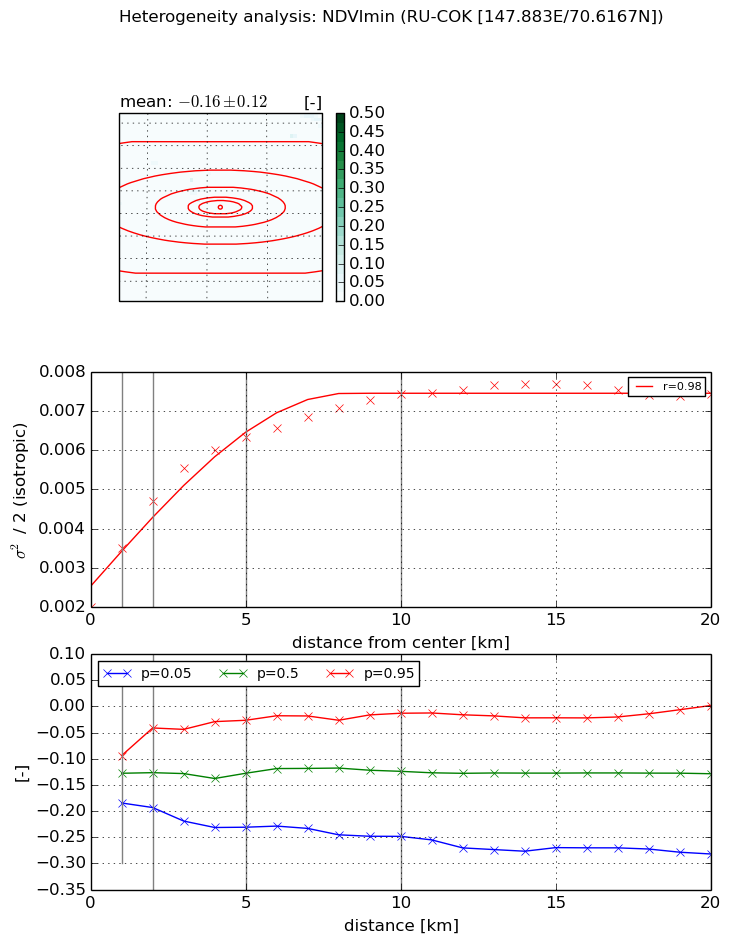
Heterogeneity analysis

The heterogeneity analysis provides information about the spatial and temporal heterogeneity of the site.

Topography


Roman et al. (2009) index


St

2.01932365226

Rcv

0.0125150920604

Rse

0.0

Rst

-0.10321989859

Rsv

1.36991095652


Height range @ 1km [m]

26

Height range @ 2km [m]

26

Height range @ 5km [m]

26

Height range @ 10km [m]

-999

Height range @ 20km [m]

-999


Variance slope @ 1 km

24

Variance slope @ 2 km

20

Variance slope @ 5 km

15

Variance slope @ 10 km

-999

Variance slope @ 20 km

-999


NDVI (max. NDVI composite)


Roman et al. (2009) index


St

7.72987031064

Rcv

0.097669809243

Rse

0.0

Rst

-0.0329423833033

Rsv

0.257492637087


NDVI range @ 1km [-]

0.11

NDVI range @ 2km [-]

0.14

NDVI range @ 5km [-]

0.17

NDVI range @ 10km [-]

0.12

NDVI range @ 20km [-]

0.11


Variance slope @ 1 km

0.000224910757085

Variance slope @ 2 km

0.000230317174184

Variance slope @ 5 km

0.00017365389449

Variance slope @ 10 km

9.03936133925e-05

Variance slope @ 20 km

4.53757043338e-05


NDVI (min. NDVI composite)I


Roman et al. (2009) index


St

3.01253912075

Rcv

0.0942579270443

Rse

0.0

Rst

0.405847893152

Rsv

-0.495731870123


NDVI range @ 1km [-]

0.09

NDVI range @ 2km [-]

0.15

NDVI range @ 5km [-]

0.2

NDVI range @ 10km [-]

0.24

NDVI range @ 20km [-]

0.28


NDVI slope @ 1 km

0.00149480040305

NDVI slope @ 2 km

0.00134196387188

NDVI slope @ 5 km

0.00085595910247

NDVI slope @ 10 km

0.000477185029461

NDVI slope @ 20 km

0.000194015225131


Temporal stability analysis

+000 deg (BHR)


BHR statistics

Temporal stability [1/decade]:


abs

rel


Weighted least square:

None


Ordinary least square:

None


Probabilities that GCOS criteria is met:

Weighted least square:

None %

Ordinary least square:

None %


DHR statistics

Temporal stability [1/decade]:


abs

rel


Weighted least square:

None


Ordinary least square:

None


Probabilities that GCOS criteria is met:

Weighted least square:

None %

Ordinary least square:

None %


+057/+063 deg (BHR)


BHR statistics

Temporal stability [1/decade]:


abs

rel


Weighted least square:

None


Ordinary least square:

None


Probabilities that GCOS criteria is met:

Weighted least square:

None %

Ordinary least square:

None %


DHR statistics

Temporal stability [1/decade]:


abs

rel


Weighted least square:

None


Ordinary least square:

None


Probabilities that GCOS criteria is met:

Weighted least square:

None %

Ordinary least square:

None %


Temporal anomaly analyis

The variance of the temporal anomalies provides an additional measure about the stability of the signal AFTER removal of the mean seasonal cylce.

+000 deg


+057/+063 deg