RU-HA1


Location

lon / lat [deg]: 90.0022 / 54.7253

Source network: FLUXNET


Geostationary surface albedo (GSA) data


“+000”


“+057/+063”


Landcover information (based on ESA CCI landcover data)


Landcover fractions @ 2km distance


Landcover fractions @ 20 km distance


Legend


Distance to open water bodies [km]:

2.15

Distance to urban areas [km]:

14.91


Radius: 1 km

Number of landcover classes:

1

Dominant landcover type:

150: Sparse vegetation (tree, shrub, herbaceous cover) (<15%)

Fraction of dominant landcover type [%]:

100.0


Radius: 2 km

Number of landcover classes:

2

Dominant landcover type:

150: Sparse vegetation (tree, shrub, herbaceous cover) (<15%)

Fraction of dominant landcover type [%]:

97.0


Radius: 5 km

Number of landcover classes:

3

Dominant landcover type:

150: Sparse vegetation (tree, shrub, herbaceous cover) (<15%)

Fraction of dominant landcover type [%]:

90.0


Radius: 10 km

Number of landcover classes:

4

Dominant landcover type:

150: Sparse vegetation (tree, shrub, herbaceous cover) (<15%)

Fraction of dominant landcover type [%]:

78.0


Radius: 20 km

Number of landcover classes:

7

Dominant landcover type:

150: Sparse vegetation (tree, shrub, herbaceous cover) (<15%)

Fraction of dominant landcover type [%]:

56.0


Disturbances


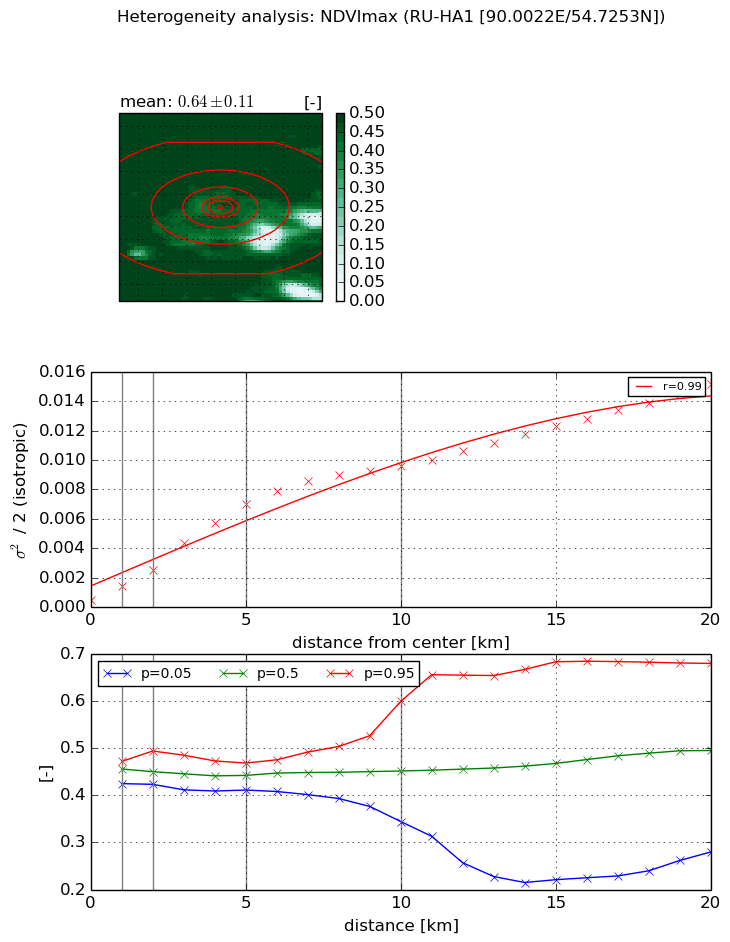
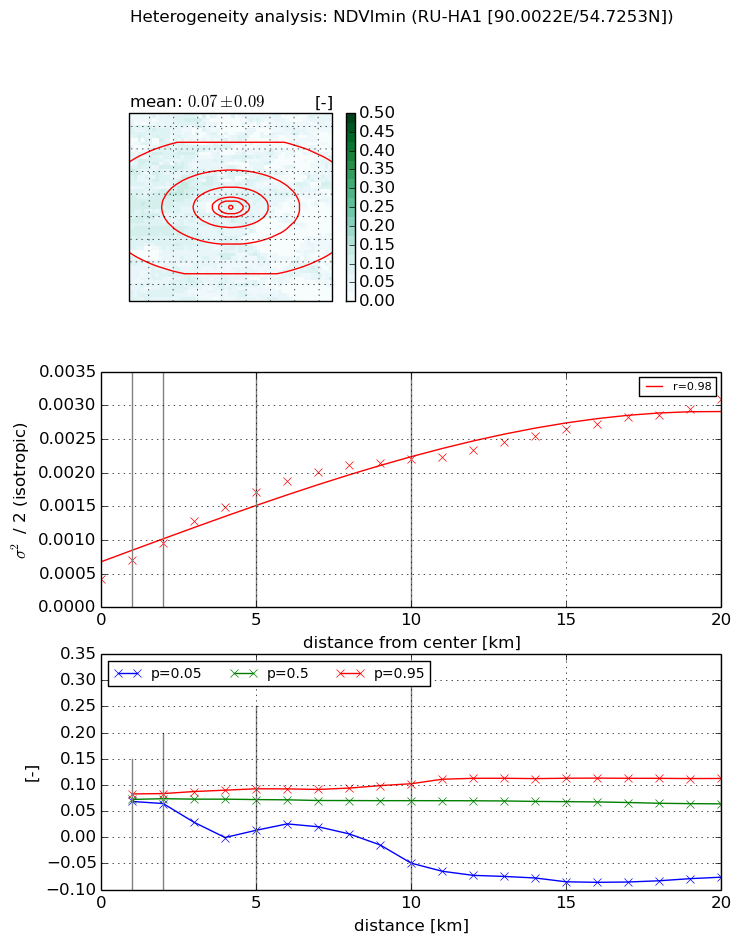
Heterogeneity analysis

The heterogeneity analysis provides information about the spatial and temporal heterogeneity of the site.

Topography


Roman et al. (2009) index


St

8.46260135098e-06

Rcv

-0.0666877056729

Rse

0.0

Rst

0.0625267732334

Rsv

354500.794979


Height range @ 1km [m]

65

Height range @ 2km [m]

123

Height range @ 5km [m]

125

Height range @ 10km [m]

-999

Height range @ 20km [m]

-999


Variance slope @ 1 km

534

Variance slope @ 2 km

605

Variance slope @ 5 km

538

Variance slope @ 10 km

-999

Variance slope @ 20 km

-999


NDVI (max. NDVI composite)


Roman et al. (2009) index


St

11.7226181334

Rcv

-0.112458792457

Rse

0.0

Rst

0.0215150700268

Rsv

0.121941664736


NDVI range @ 1km [-]

0.05

NDVI range @ 2km [-]

0.07

NDVI range @ 5km [-]

0.06

NDVI range @ 10km [-]

0.26

NDVI range @ 20km [-]

0.4


Variance slope @ 1 km

0.000944769432344

Variance slope @ 2 km

0.00101642325155

Variance slope @ 5 km

0.00135502113952

Variance slope @ 10 km

0.000970931507199

Variance slope @ 20 km

0.000668083082721


NDVI (min. NDVI composite)I


Roman et al. (2009) index


St

3.61337352049

Rcv

0.116807408542

Rse

0.0

Rst

0.170170200932

Rsv

-0.543271459157


NDVI range @ 1km [-]

0.01

NDVI range @ 2km [-]

0.02

NDVI range @ 5km [-]

0.08

NDVI range @ 10km [-]

0.15

NDVI range @ 20km [-]

0.19


NDVI slope @ 1 km

0.00028184191706

NDVI slope @ 2 km

0.00026751901857

NDVI slope @ 5 km

0.000262855629175

NDVI slope @ 10 km

0.000183086561653

NDVI slope @ 20 km

0.000116875599095


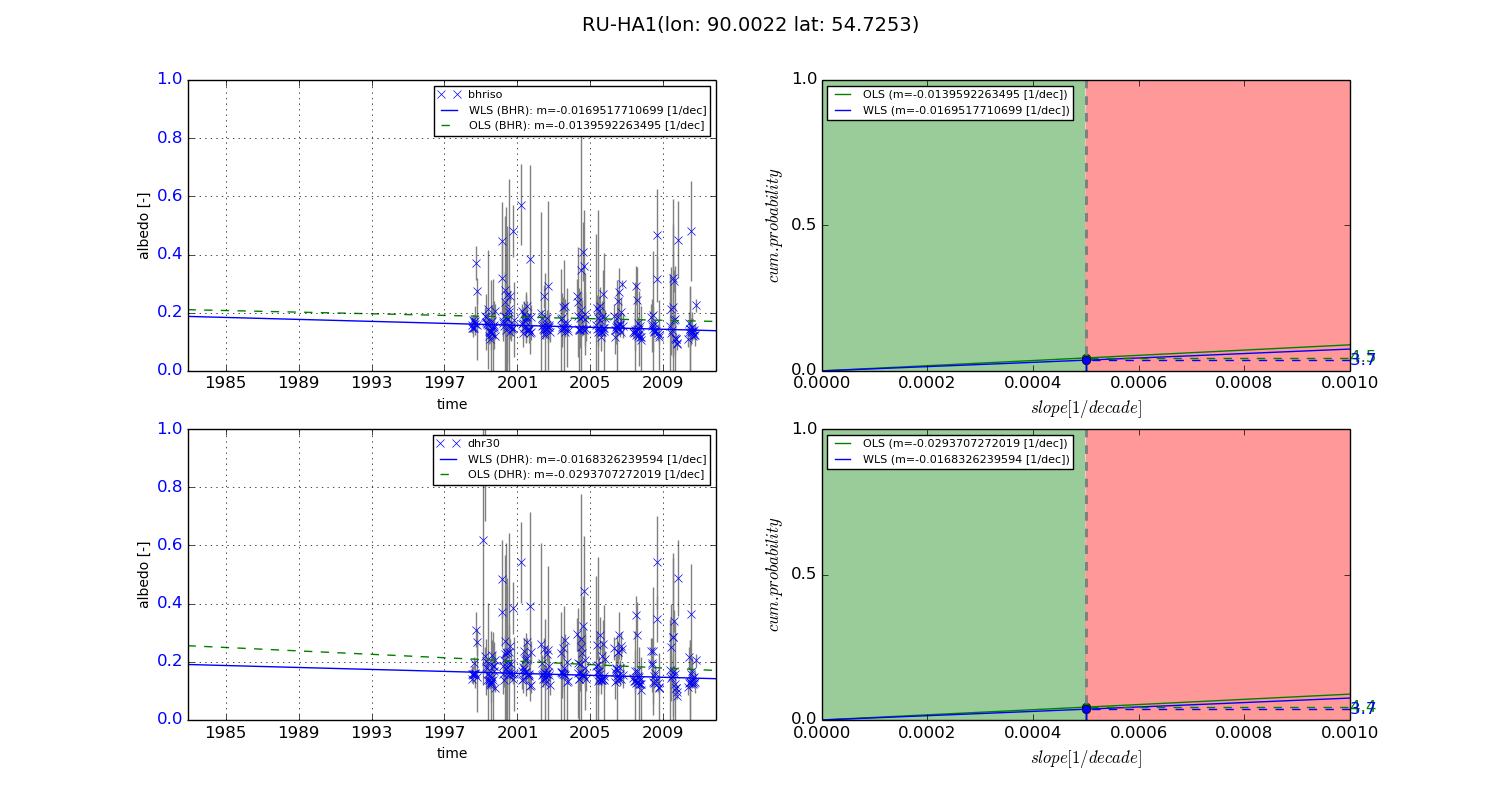
Temporal stability analysis

+000 deg (BHR)


BHR statistics

Temporal stability [1/decade]:


abs

rel


Weighted least square:

None


Ordinary least square:

None


Probabilities that GCOS criteria is met:

Weighted least square:

None %

Ordinary least square:

None %


DHR statistics

Temporal stability [1/decade]:


abs

rel


Weighted least square:

None


Ordinary least square:

None


Probabilities that GCOS criteria is met:

Weighted least square:

None %

Ordinary least square:

None %


+057/+063 deg (BHR)


BHR statistics

Temporal stability [1/decade]:


abs

rel


Weighted least square:

-0.0169517710699


Ordinary least square:

-0.0139592263495


Probabilities that GCOS criteria is met:

Weighted least square:

3.7 %

Ordinary least square:

4.5 %


DHR statistics

Temporal stability [1/decade]:


abs

rel


Weighted least square:

-0.0168326239594


Ordinary least square:

-0.0293707272019


Probabilities that GCOS criteria is met:

Weighted least square:

3.7 %

Ordinary least square:

4.4 %


Temporal anomaly analyis

The variance of the temporal anomalies provides an additional measure about the stability of the signal AFTER removal of the mean seasonal cylce.

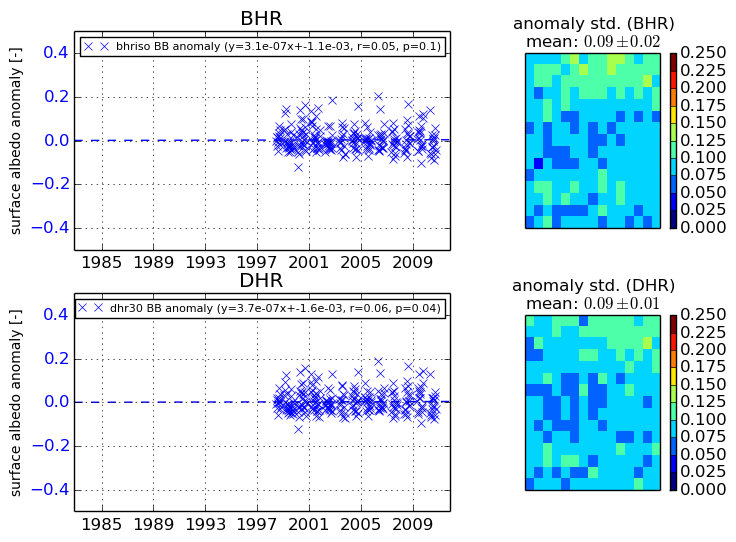
+000 deg


+057/+063 deg