RU-HA2


Location

lon / lat [deg]: 89.9567 / 54.7731

Source network: FLUXNET


Geostationary surface albedo (GSA) data


“+000”


“+057/+063”


Landcover information (based on ESA CCI landcover data)


Landcover fractions @ 2km distance


Landcover fractions @ 20 km distance


Legend


Distance to open water bodies [km]:

2.32

Distance to urban areas [km]:

13.9


Radius: 1 km

Number of landcover classes:

3

Dominant landcover type:

150: Sparse vegetation (tree, shrub, herbaceous cover) (<15%)

Fraction of dominant landcover type [%]:

93.0


Radius: 2 km

Number of landcover classes:

1

Dominant landcover type:

150: Sparse vegetation (tree, shrub, herbaceous cover) (<15%)

Fraction of dominant landcover type [%]:

98.0


Radius: 5 km

Number of landcover classes:

4

Dominant landcover type:

150: Sparse vegetation (tree, shrub, herbaceous cover) (<15%)

Fraction of dominant landcover type [%]:

77.0


Radius: 10 km

Number of landcover classes:

6

Dominant landcover type:

150: Sparse vegetation (tree, shrub, herbaceous cover) (<15%)

Fraction of dominant landcover type [%]:

67.0


Radius: 20 km

Number of landcover classes:

8

Dominant landcover type:

150: Sparse vegetation (tree, shrub, herbaceous cover) (<15%)

Fraction of dominant landcover type [%]:

50.0


Disturbances


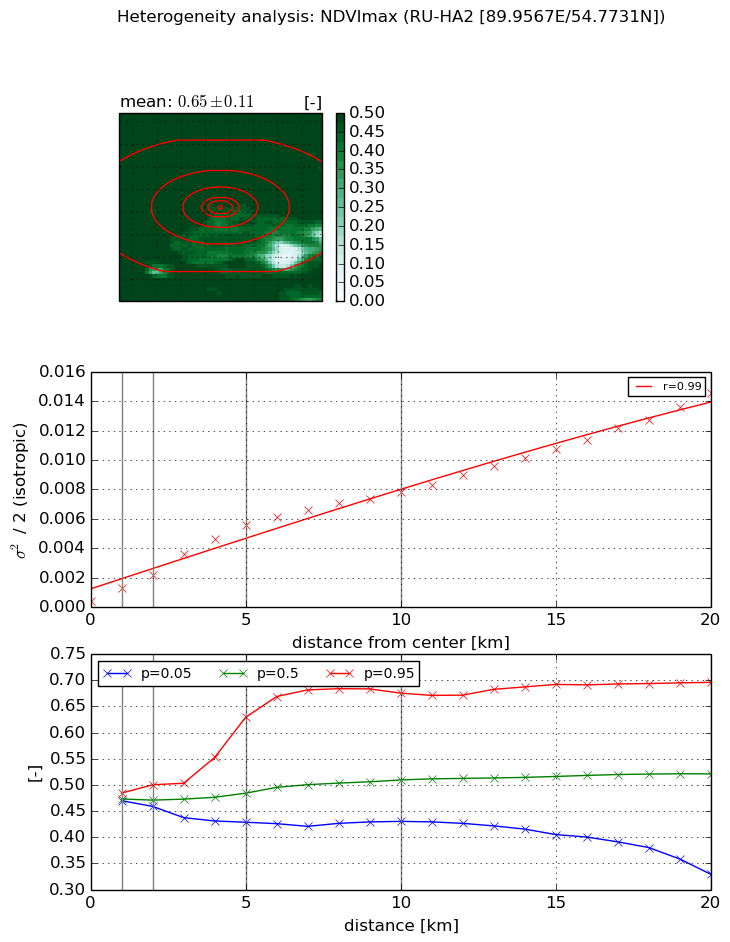
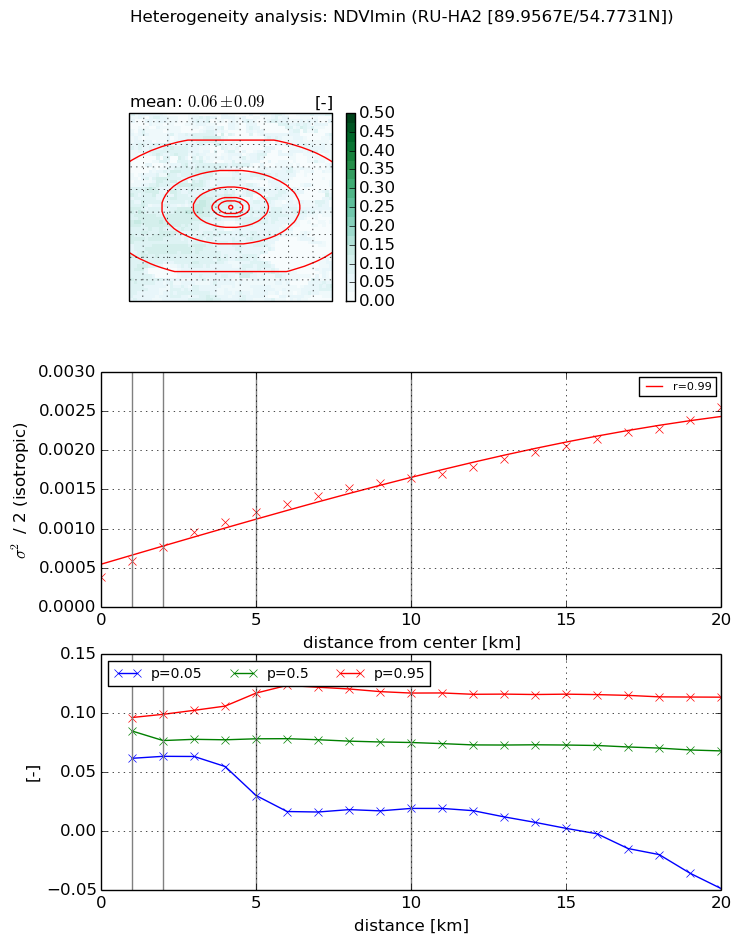
Heterogeneity analysis

The heterogeneity analysis provides information about the spatial and temporal heterogeneity of the site.

Topography


Roman et al. (2009) index


St

2.3742418592

Rcv

0.263560297423

Rse

0.0

Rst

-9.48161915251e-07

Rsv

-0.999999999606


Height range @ 1km [m]

76

Height range @ 2km [m]

78

Height range @ 5km [m]

131

Height range @ 10km [m]

-999

Height range @ 20km [m]

-999


Variance slope @ 1 km

258

Variance slope @ 2 km

303

Variance slope @ 5 km

408

Variance slope @ 10 km

-999

Variance slope @ 20 km

-999


NDVI (max. NDVI composite)


Roman et al. (2009) index


St

1.55124513048

Rcv

1.56202082673

Rse

0.0

Rst

-9.45186571835e-09

Rsv

0.371909489245


NDVI range @ 1km [-]

0.01

NDVI range @ 2km [-]

0.04

NDVI range @ 5km [-]

0.2

NDVI range @ 10km [-]

0.25

NDVI range @ 20km [-]

0.37


Variance slope @ 1 km

0.00084535234772

Variance slope @ 2 km

0.000874869994876

Variance slope @ 5 km

0.00105639497036

Variance slope @ 10 km

0.000758304206546

Variance slope @ 20 km

0.000639720508371


NDVI (min. NDVI composite)I


Roman et al. (2009) index


St

1.63743390588

Rcv

0.876101348631

Rse

0.0

Rst

-0.159625043206

Rsv

0.796408627006


NDVI range @ 1km [-]

0.03

NDVI range @ 2km [-]

0.04

NDVI range @ 5km [-]

0.09

NDVI range @ 10km [-]

0.1

NDVI range @ 20km [-]

0.16


NDVI slope @ 1 km

0.000207770687246

NDVI slope @ 2 km

0.000189035749089

NDVI slope @ 5 km

0.000166176873286

NDVI slope @ 10 km

0.000124232698952

NDVI slope @ 20 km

9.60619769433e-05


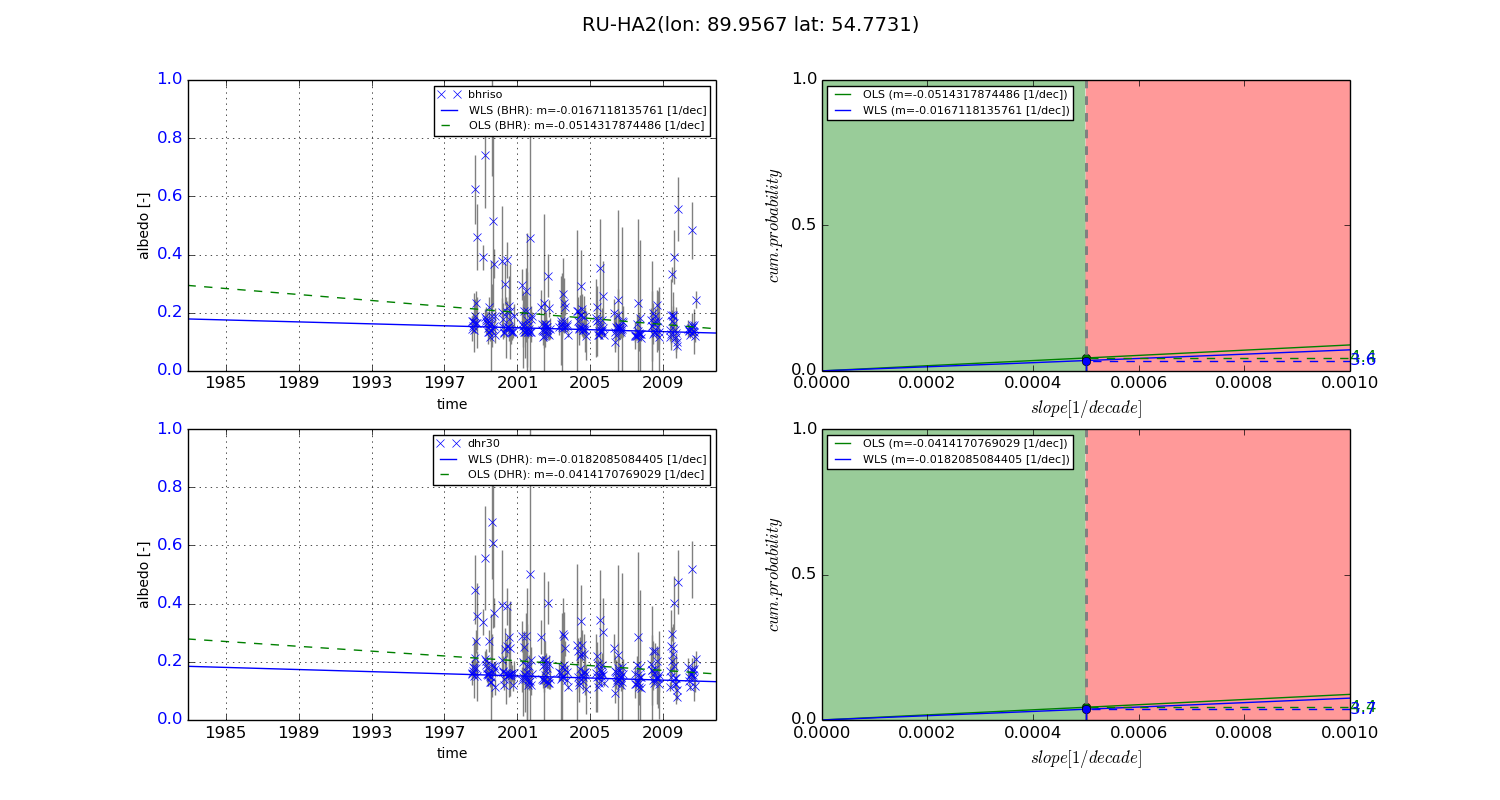
Temporal stability analysis

+000 deg (BHR)


BHR statistics

Temporal stability [1/decade]:


abs

rel


Weighted least square:

None


Ordinary least square:

None


Probabilities that GCOS criteria is met:

Weighted least square:

None %

Ordinary least square:

None %


DHR statistics

Temporal stability [1/decade]:


abs

rel


Weighted least square:

None


Ordinary least square:

None


Probabilities that GCOS criteria is met:

Weighted least square:

None %

Ordinary least square:

None %


+057/+063 deg (BHR)


BHR statistics

Temporal stability [1/decade]:


abs

rel


Weighted least square:

-0.0167118135761


Ordinary least square:

-0.0514317874486


Probabilities that GCOS criteria is met:

Weighted least square:

3.6 %

Ordinary least square:

4.4 %


DHR statistics

Temporal stability [1/decade]:


abs

rel


Weighted least square:

-0.0182085084405


Ordinary least square:

-0.0414170769029


Probabilities that GCOS criteria is met:

Weighted least square:

3.7 %

Ordinary least square:

4.4 %


Temporal anomaly analyis

The variance of the temporal anomalies provides an additional measure about the stability of the signal AFTER removal of the mean seasonal cylce.

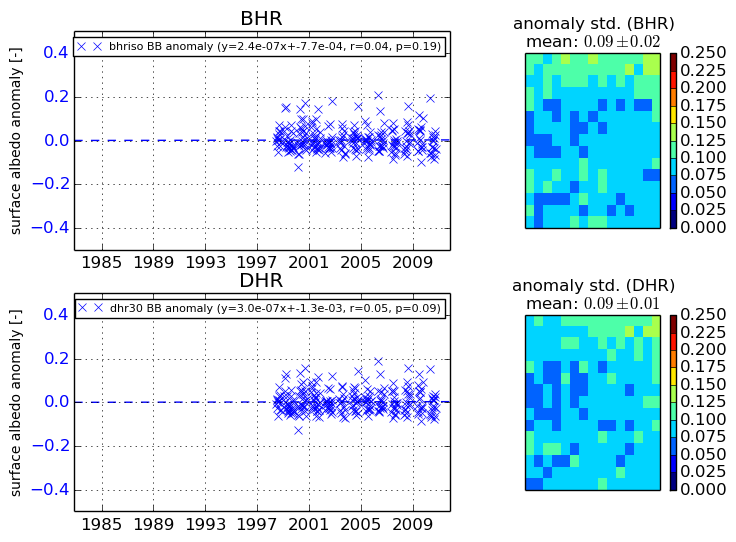
+000 deg


+057/+063 deg