SACLAY


Location

lon / lat [deg]: 2.1667 / 48.7333

Source network: AERONET


Geostationary surface albedo (GSA) data


“+000”


“+057/+063”


Landcover information (based on ESA CCI landcover data)


Landcover fractions @ 2km distance


Landcover fractions @ 20 km distance


Legend


Distance to open water bodies [km]:

0.78

Distance to urban areas [km]:

0.18


Radius: 1 km

Number of landcover classes:

3

Dominant landcover type:

10: cropland, rainfed

Fraction of dominant landcover type [%]:

67.0


Radius: 2 km

Number of landcover classes:

3

Dominant landcover type:

10: cropland, rainfed

Fraction of dominant landcover type [%]:

70.0


Radius: 5 km

Number of landcover classes:

4

Dominant landcover type:

190: urban areas

Fraction of dominant landcover type [%]:

47.0


Radius: 10 km

Number of landcover classes:

3

Dominant landcover type:

190: urban areas

Fraction of dominant landcover type [%]:

59.0


Radius: 20 km

Number of landcover classes:

3

Dominant landcover type:

190: urban areas

Fraction of dominant landcover type [%]:

61.0


Disturbances


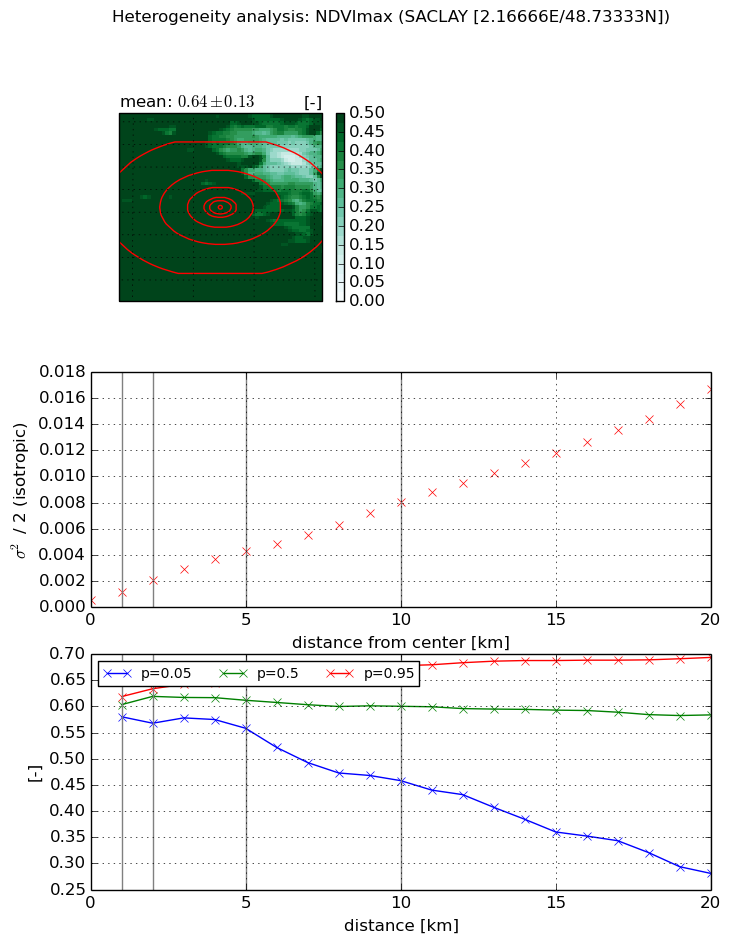
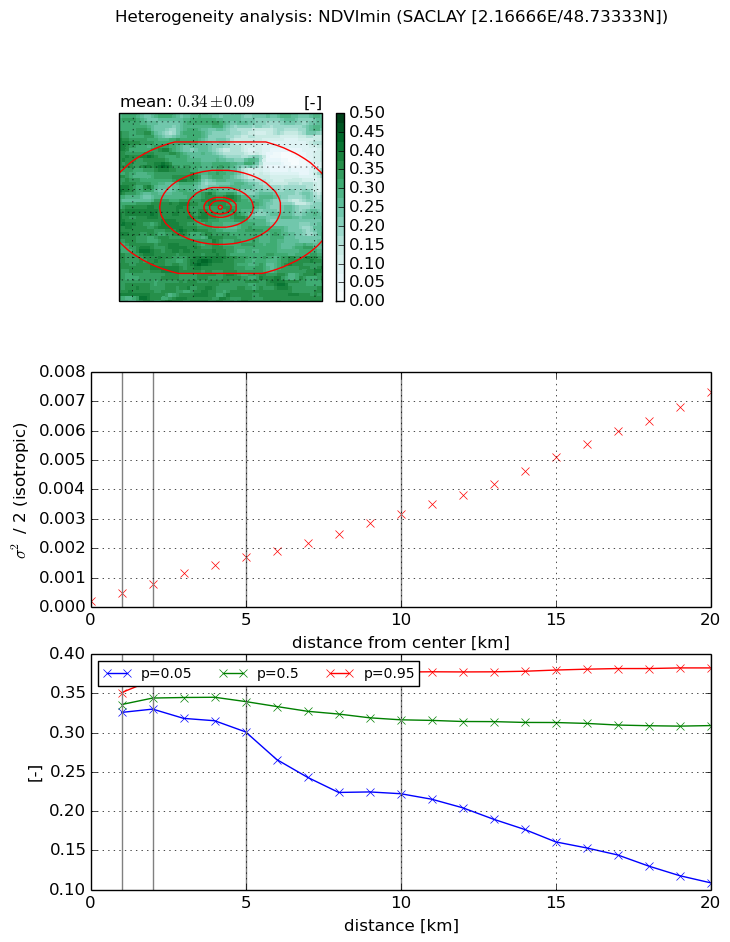
Heterogeneity analysis

The heterogeneity analysis provides information about the spatial and temporal heterogeneity of the site.

Topography


Roman et al. (2009) index


St

1.09700183548e-16

Rcv

2.74221029059

Rse

0.0

Rst

-0.109602357665

Rsv

2.73472650909e+16


Height range @ 1km [m]

13

Height range @ 2km [m]

19

Height range @ 5km [m]

93

Height range @ 10km [m]

-999

Height range @ 20km [m]

-999


Variance slope @ 1 km

665

Variance slope @ 2 km

485

Variance slope @ 5 km

129

Variance slope @ 10 km

-999

Variance slope @ 20 km

-999


NDVI (max. NDVI composite)


Roman et al. (2009) index


St

1.40885031382

Rcv

0.661664551867

Rse

0.0

Rst

-0.46773163392

Rsv

-0.999999656043


NDVI range @ 1km [-]

0.04

NDVI range @ 2km [-]

0.07

NDVI range @ 5km [-]

0.1

NDVI range @ 10km [-]

0.22

NDVI range @ 20km [-]

0.41


Variance slope @ 1 km

0.000635044378434

Variance slope @ 2 km

0.00075272065599

Variance slope @ 5 km

0.000777901913821

Variance slope @ 10 km

0.000734522076746

Variance slope @ 20 km

0.000781603677342


NDVI (min. NDVI composite)I


Roman et al. (2009) index


St

nan

Rcv

nan

Rse

nan

Rst

nan

Rsv

nan


NDVI range @ 1km [-]

0.03

NDVI range @ 2km [-]

0.04

NDVI range @ 5km [-]

0.08

NDVI range @ 10km [-]

0.16

NDVI range @ 20km [-]

0.27


NDVI slope @ 1 km

0.000250713452174

NDVI slope @ 2 km

0.000293475246901

NDVI slope @ 5 km

0.000303581190203

NDVI slope @ 10 km

0.000290227270195

NDVI slope @ 20 km

0.000348254256413


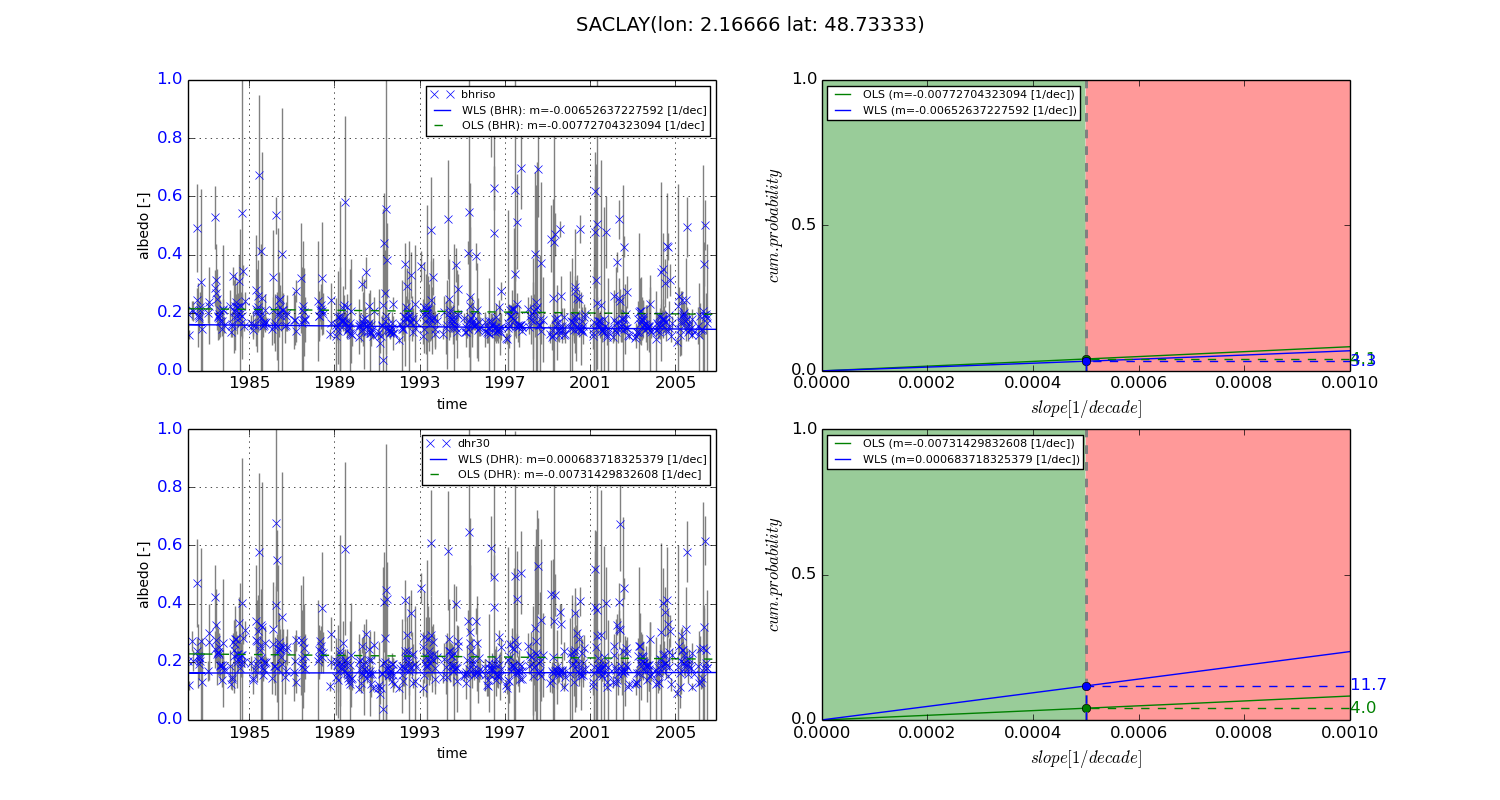
Temporal stability analysis

+000 deg (BHR)


BHR statistics

Temporal stability [1/decade]:


abs

rel


Weighted least square:

-0.00652637227592


Ordinary least square:

-0.00772704323094


Probabilities that GCOS criteria is met:

Weighted least square:

3.3 %

Ordinary least square:

4.1 %


DHR statistics

Temporal stability [1/decade]:


abs

rel


Weighted least square:

0.000683718325379


Ordinary least square:

-0.00731429832608


Probabilities that GCOS criteria is met:

Weighted least square:

11.7 %

Ordinary least square:

4.0 %


+057/+063 deg (BHR)


BHR statistics

Temporal stability [1/decade]:


abs

rel


Weighted least square:

-99999.0


Ordinary least square:

-99999.0


Probabilities that GCOS criteria is met:

Weighted least square:

-99999.0 %

Ordinary least square:

-99999.0 %


DHR statistics

Temporal stability [1/decade]:


abs

rel


Weighted least square:

-99999.0


Ordinary least square:

-99999.0


Probabilities that GCOS criteria is met:

Weighted least square:

-99999.0 %

Ordinary least square:

-99999.0 %


Temporal anomaly analyis

The variance of the temporal anomalies provides an additional measure about the stability of the signal AFTER removal of the mean seasonal cylce.
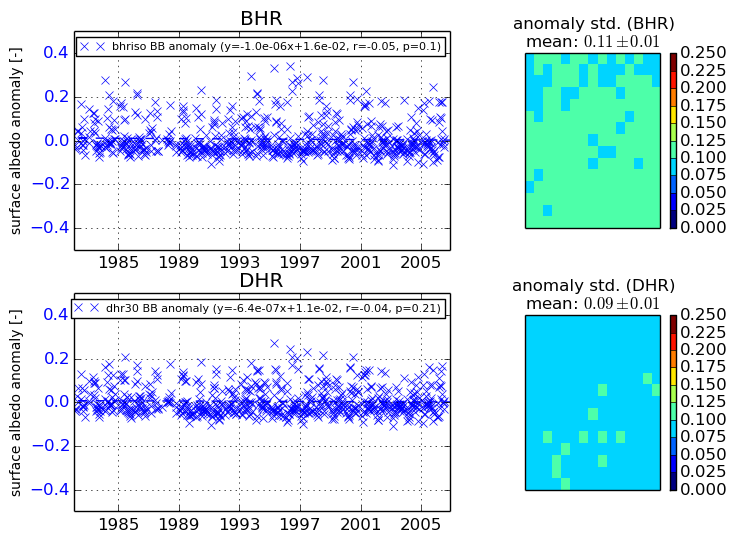
+000 deg


+057/+063 deg