SAIH_SALAM


Location

lon / lat [deg]: 55.3128 / 24.8295

Source network: AERONET


Geostationary surface albedo (GSA) data


“+000”


“+057/+063”


Landcover information (based on ESA CCI landcover data)


Landcover fractions @ 2km distance


Landcover fractions @ 20 km distance


Legend


Distance to open water bodies [km]:

29.1

Distance to urban areas [km]:

37.76


Radius: 1 km

Number of landcover classes:

1

Dominant landcover type:

200: bare areas

Fraction of dominant landcover type [%]:

100.0


Radius: 2 km

Number of landcover classes:

1

Dominant landcover type:

200: bare areas

Fraction of dominant landcover type [%]:

100.0


Radius: 5 km

Number of landcover classes:

1

Dominant landcover type:

200: bare areas

Fraction of dominant landcover type [%]:

100.0


Radius: 10 km

Number of landcover classes:

1

Dominant landcover type:

200: bare areas

Fraction of dominant landcover type [%]:

100.0


Radius: 20 km

Number of landcover classes:

1

Dominant landcover type:

200: bare areas

Fraction of dominant landcover type [%]:

100.0


Disturbances


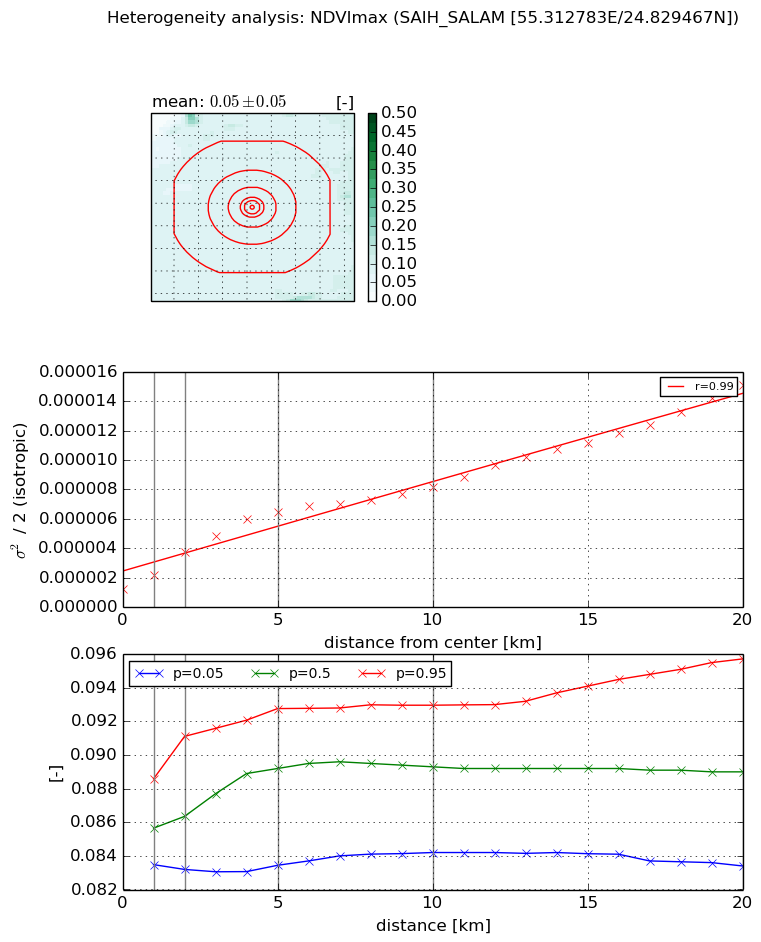
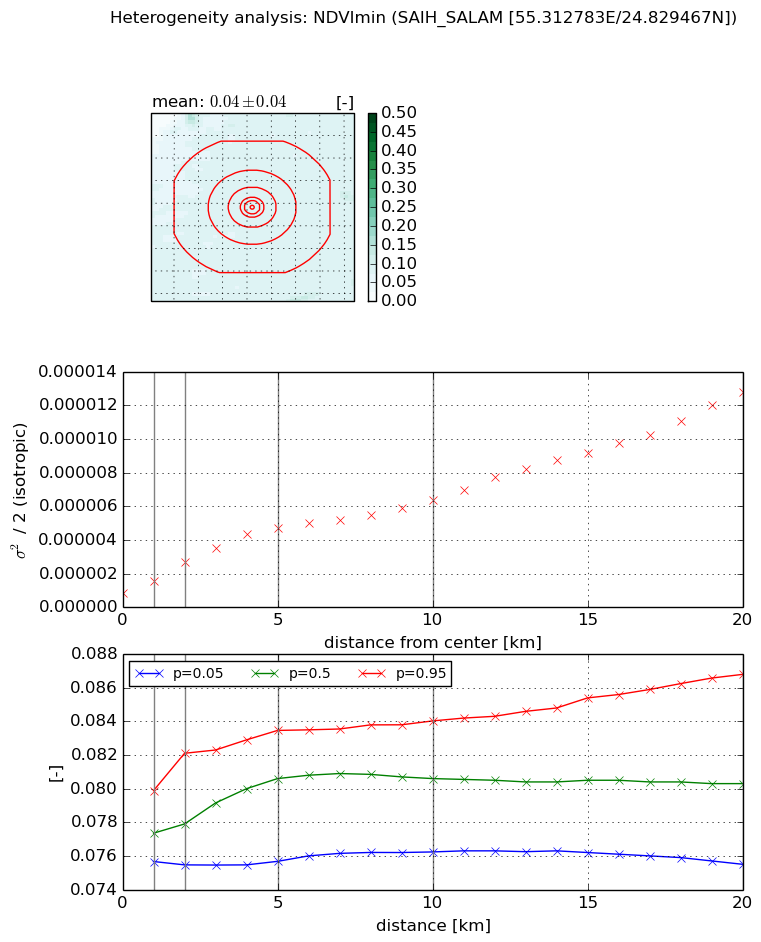
Heterogeneity analysis

The heterogeneity analysis provides information about the spatial and temporal heterogeneity of the site.

Topography


Roman et al. (2009) index


St

2.2195574564

Rcv

0.261318087735

Rse

0.0

Rst

-0.0903046371897

Rsv

-0.999998063871


Height range @ 1km [m]

18

Height range @ 2km [m]

22

Height range @ 5km [m]

33

Height range @ 10km [m]

-999

Height range @ 20km [m]

-999


Variance slope @ 1 km

17

Variance slope @ 2 km

12

Variance slope @ 5 km

16

Variance slope @ 10 km

-999

Variance slope @ 20 km

-999


NDVI (max. NDVI composite)


Roman et al. (2009) index


St

12.8254332858

Rcv

-0.00460093915305

Rse

0.0

Rst

-0.145796386424

Rsv

0.0835129005443


NDVI range @ 1km [-]

0.01

NDVI range @ 2km [-]

0.01

NDVI range @ 5km [-]

0.01

NDVI range @ 10km [-]

0.01

NDVI range @ 20km [-]

0.01


Variance slope @ 1 km

9.75663141549e-07

Variance slope @ 2 km

1.2717948598e-06

Variance slope @ 5 km

1.10581043939e-06

Variance slope @ 10 km

6.61712958425e-07

Variance slope @ 20 km

6.04563457944e-07


NDVI (min. NDVI composite)I


Roman et al. (2009) index


St

16.0306303445

Rcv

-0.00274080224773

Rse

0.0

Rst

-0.144074621039

Rsv

0.0403263132227


NDVI range @ 1km [-]

0.0

NDVI range @ 2km [-]

0.01

NDVI range @ 5km [-]

0.01

NDVI range @ 10km [-]

0.01

NDVI range @ 20km [-]

0.01


NDVI slope @ 1 km

6.96407328998e-07

NDVI slope @ 2 km

9.18605896488e-07

NDVI slope @ 5 km

8.16582170173e-07

NDVI slope @ 10 km

5.25004682749e-07

NDVI slope @ 20 km

5.35696018839e-07


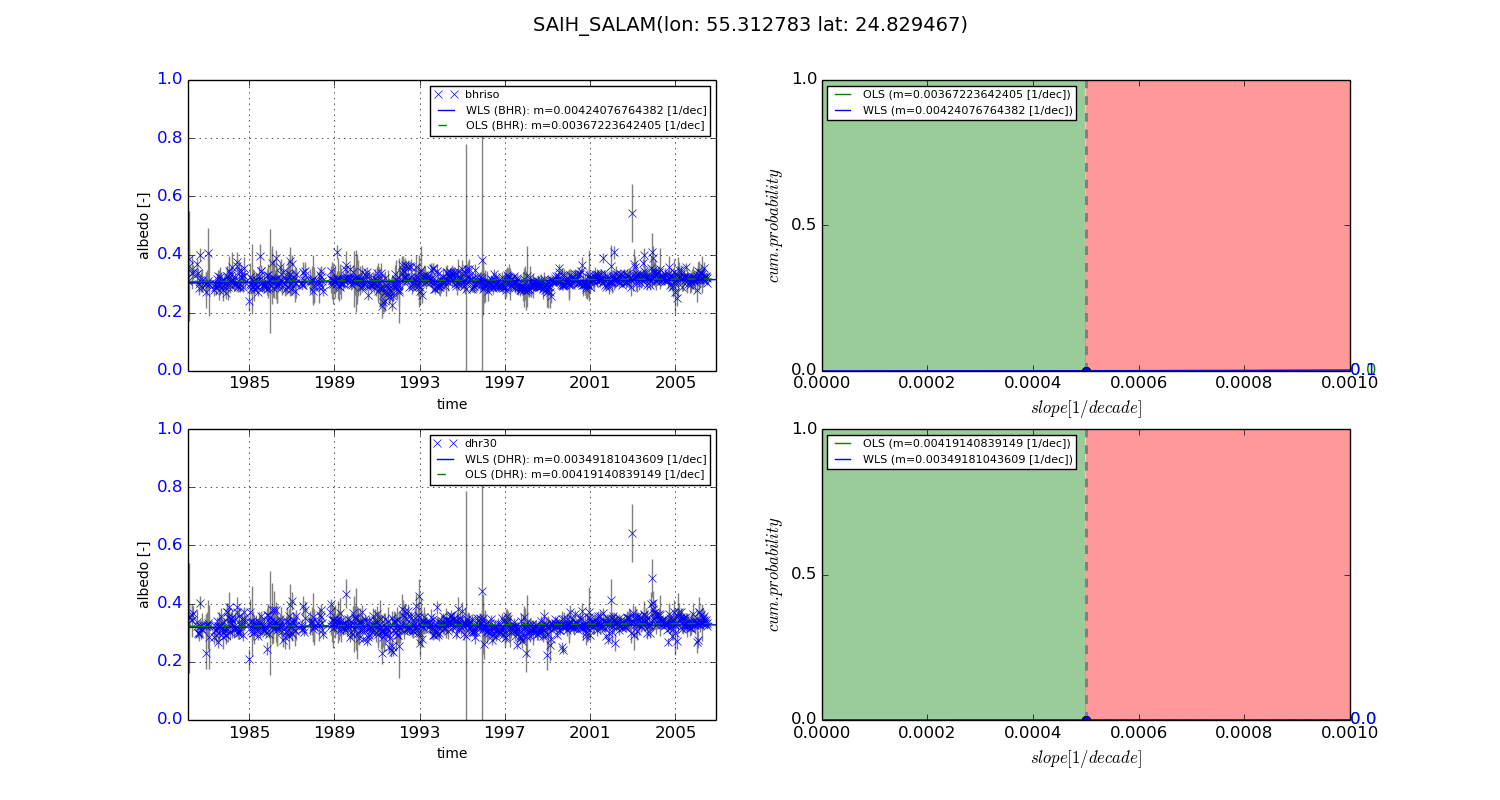
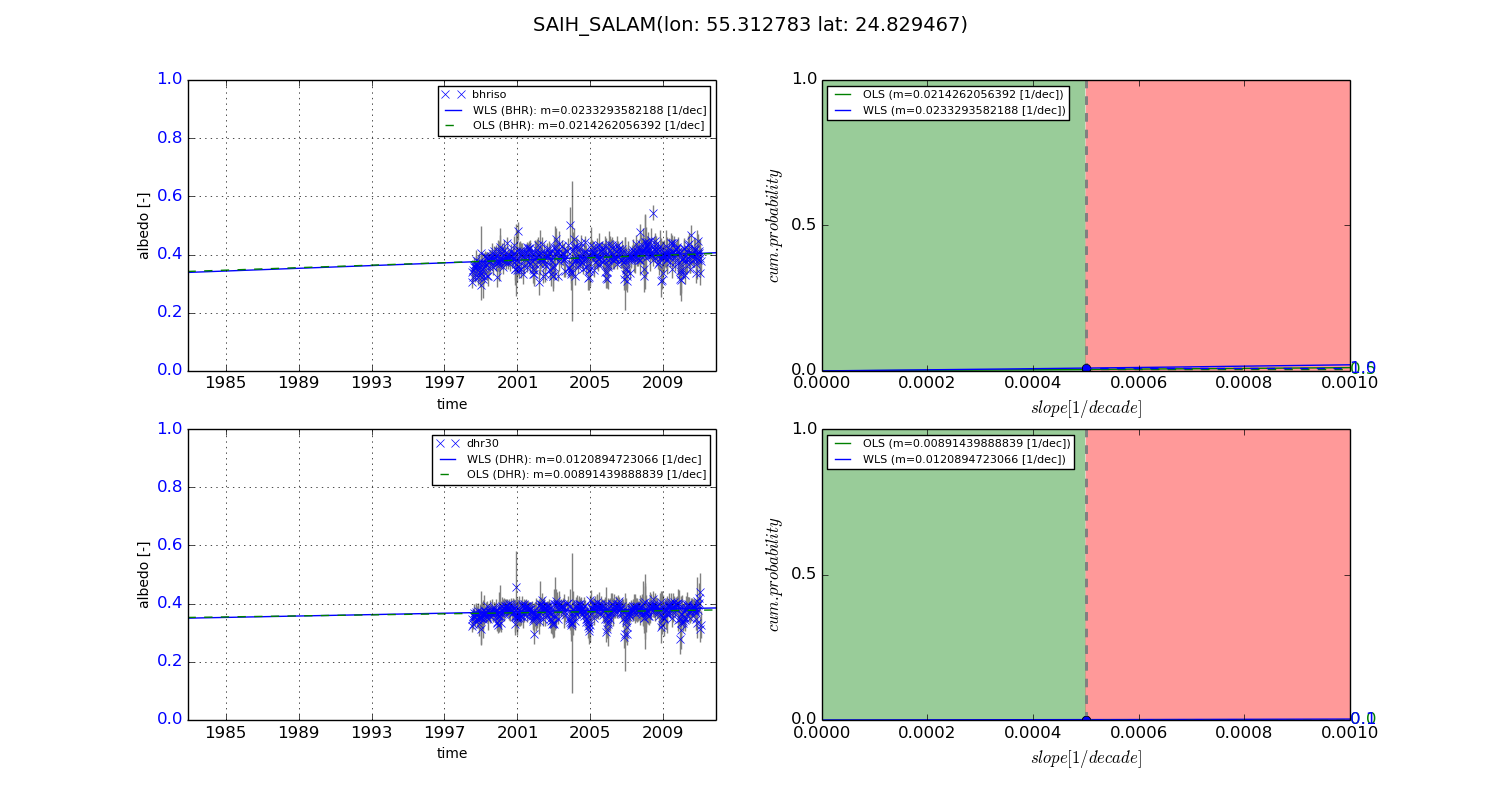
Temporal stability analysis

+000 deg (BHR)


BHR statistics

Temporal stability [1/decade]:


abs

rel


Weighted least square:

0.00424076764382


Ordinary least square:

0.00367223642405


Probabilities that GCOS criteria is met:

Weighted least square:

0.1 %

Ordinary least square:

0.0 %


DHR statistics

Temporal stability [1/decade]:


abs

rel


Weighted least square:

0.00349181043609


Ordinary least square:

0.00419140839149


Probabilities that GCOS criteria is met:

Weighted least square:

0.0 %

Ordinary least square:

0.0 %


+057/+063 deg (BHR)


BHR statistics

Temporal stability [1/decade]:


abs

rel


Weighted least square:

0.0233293582188


Ordinary least square:

0.0214262056392


Probabilities that GCOS criteria is met:

Weighted least square:

1.0 %

Ordinary least square:

0.5 %


DHR statistics

Temporal stability [1/decade]:


abs

rel


Weighted least square:

0.0120894723066


Ordinary least square:

0.00891439888839


Probabilities that GCOS criteria is met:

Weighted least square:

0.1 %

Ordinary least square:

0.0 %


Temporal anomaly analyis

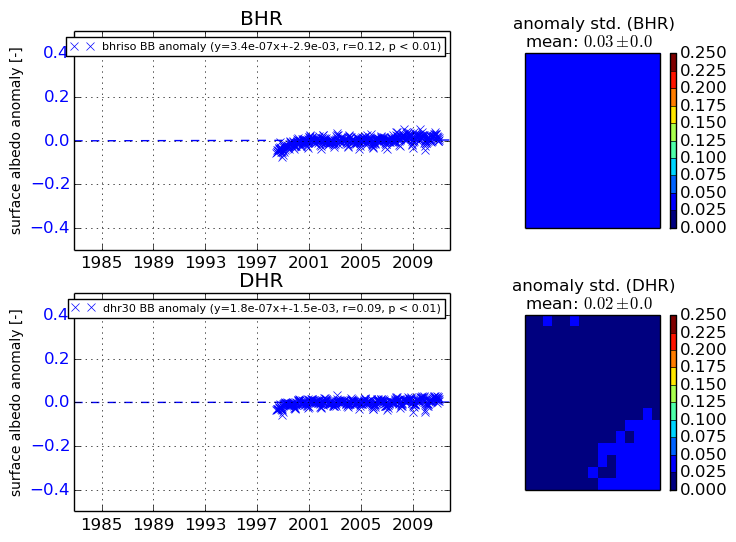
The variance of the temporal anomalies provides an additional measure about the stability of the signal AFTER removal of the mean seasonal cylce.
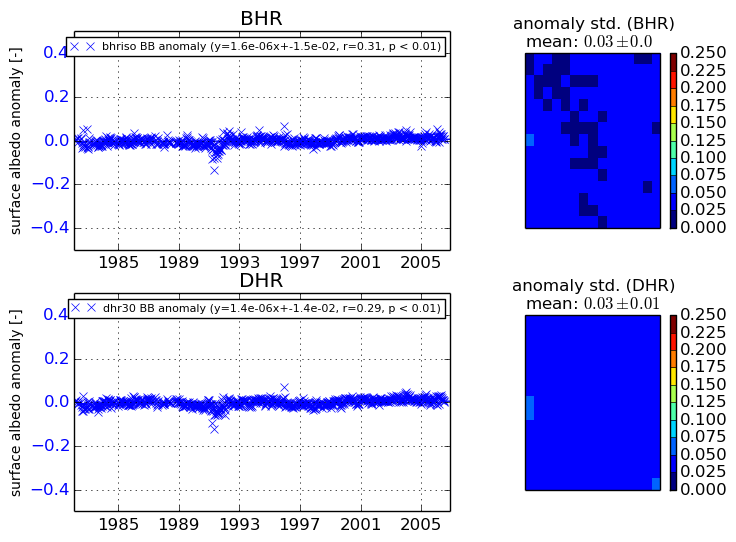
+000 deg


+057/+063 deg