SALTLAKE_HAJ_ALIGHOLI


Location

lon / lat [deg]: 54.744 / 35.94

Source network: ALBEDOVAL2


Geostationary surface albedo (GSA) data


“+000”


“+057/+063”


Landcover information (based on ESA CCI landcover data)


Landcover fractions @ 2km distance


Landcover fractions @ 20 km distance


Legend


Distance to open water bodies [km]:

0.09

Distance to urban areas [km]:

35.67


Radius: 1 km

Number of landcover classes:

1

Dominant landcover type:

210: water bodies

Fraction of dominant landcover type [%]:

100.0


Radius: 2 km

Number of landcover classes:

1

Dominant landcover type:

210: water bodies

Fraction of dominant landcover type [%]:

100.0


Radius: 5 km

Number of landcover classes:

1

Dominant landcover type:

210: water bodies

Fraction of dominant landcover type [%]:

100.0


Radius: 10 km

Number of landcover classes:

2

Dominant landcover type:

210: water bodies

Fraction of dominant landcover type [%]:

91.0


Radius: 20 km

Number of landcover classes:

2

Dominant landcover type:

200: bare areas

Fraction of dominant landcover type [%]:

56.0


Disturbances


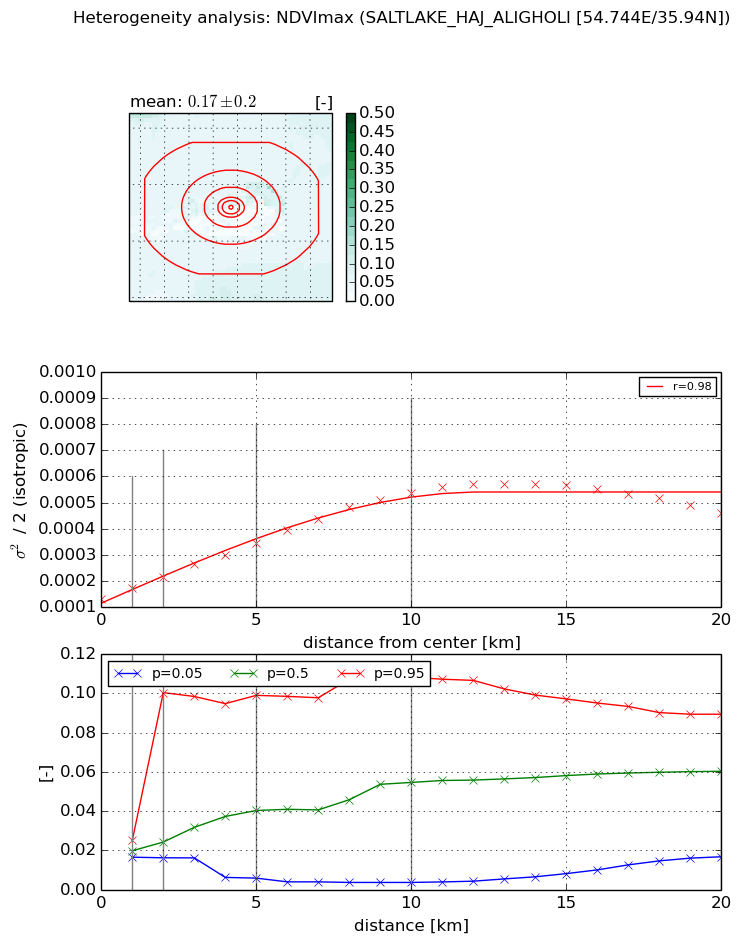
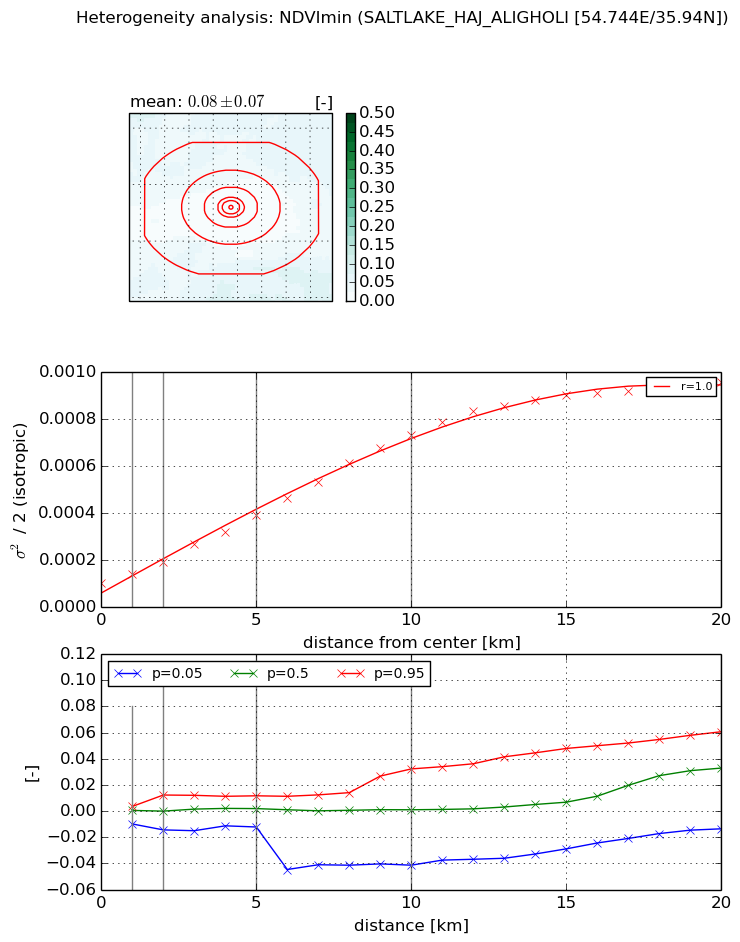
Heterogeneity analysis

The heterogeneity analysis provides information about the spatial and temporal heterogeneity of the site.

Topography


Roman et al. (2009) index


St

4.77753221634e-05

Rcv

0.0635324642544

Rse

0.0

Rst

0.145389361535

Rsv

62793.7161455


Height range @ 1km [m]

8

Height range @ 2km [m]

8

Height range @ 5km [m]

9

Height range @ 10km [m]

-999

Height range @ 20km [m]

-999


Variance slope @ 1 km

5

Variance slope @ 2 km

2

Variance slope @ 5 km

0

Variance slope @ 10 km

-999

Variance slope @ 20 km

-999


NDVI (max. NDVI composite)


Roman et al. (2009) index


St

6.19522639938

Rcv

-0.00179382438413

Rse

0.0

Rst

0.00570456675549

Rsv

0.476745413139


NDVI range @ 1km [-]

0.01

NDVI range @ 2km [-]

0.08

NDVI range @ 5km [-]

0.09

NDVI range @ 10km [-]

0.1

NDVI range @ 20km [-]

0.07


Variance slope @ 1 km

4.25591445487e-05

Variance slope @ 2 km

4.27102912817e-05

Variance slope @ 5 km

4.31064090297e-05

Variance slope @ 10 km

4.18921590428e-05

Variance slope @ 20 km

1.86898049541e-05


NDVI (min. NDVI composite)I


Roman et al. (2009) index


St

nan

Rcv

-1.53202823788

Rse

nan

Rst

nan

Rsv

-0.199412198374


NDVI range @ 1km [-]

0.01

NDVI range @ 2km [-]

0.03

NDVI range @ 5km [-]

0.02

NDVI range @ 10km [-]

0.07

NDVI range @ 20km [-]

0.07


NDVI slope @ 1 km

3.86389424725e-05

NDVI slope @ 2 km

4.48164245531e-05

NDVI slope @ 5 km

5.87070878619e-05

NDVI slope @ 10 km

6.55918421547e-05

NDVI slope @ 20 km

4.62809735012e-05


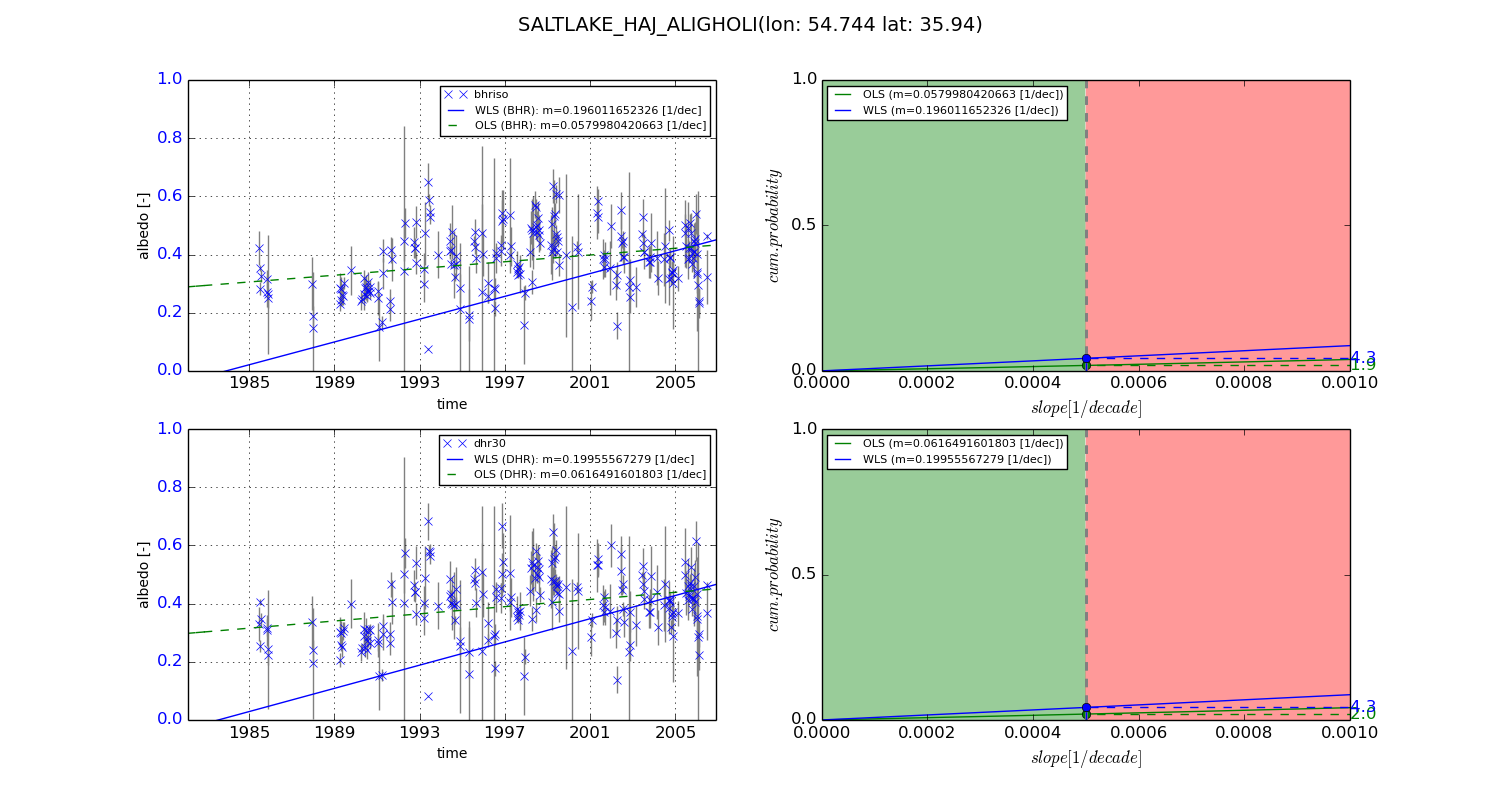
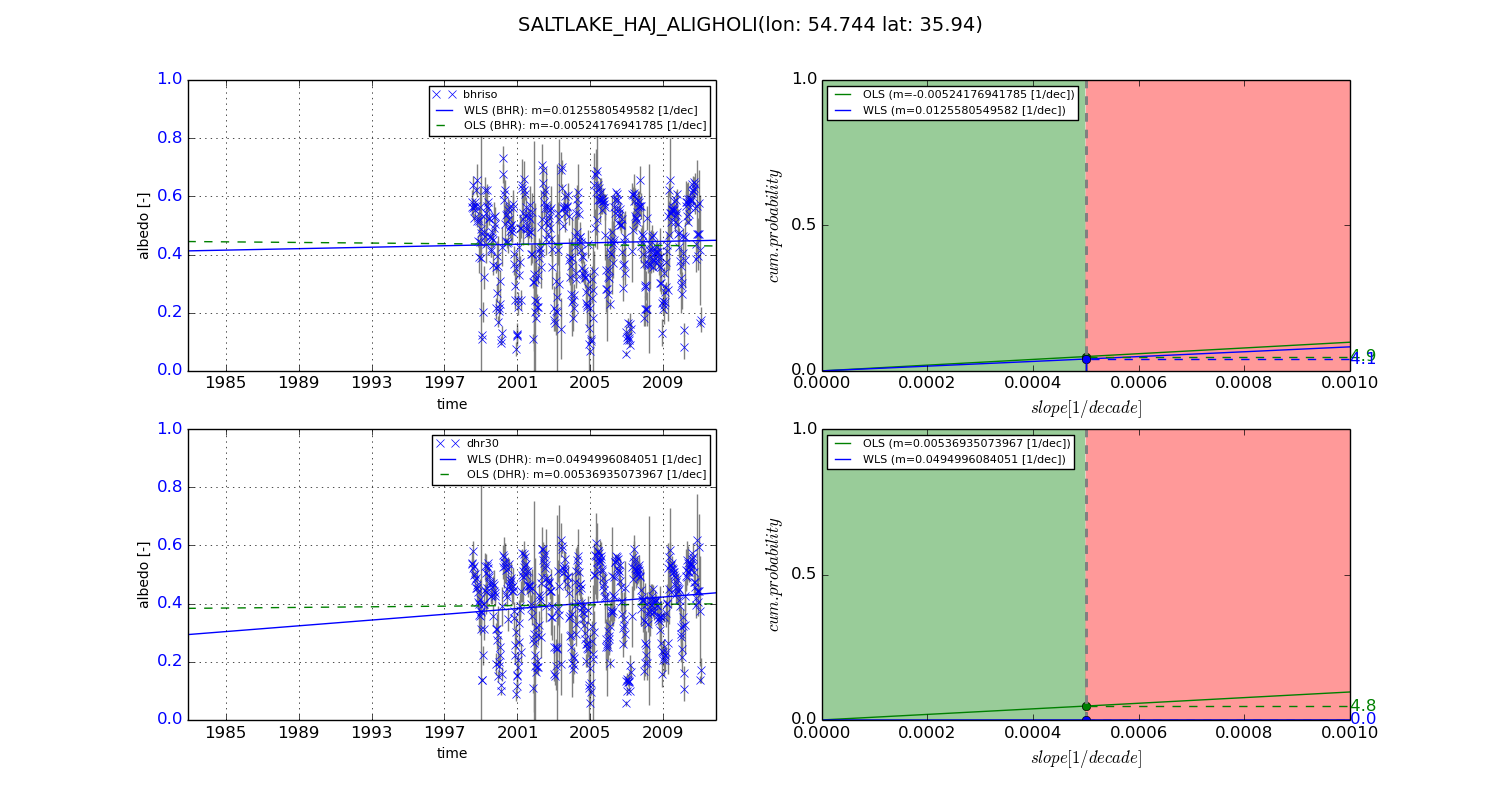
Temporal stability analysis

+000 deg (BHR)


BHR statistics

Temporal stability [1/decade]:


abs

rel


Weighted least square:

0.196011652326


Ordinary least square:

0.0579980420663


Probabilities that GCOS criteria is met:

Weighted least square:

4.3 %

Ordinary least square:

1.9 %


DHR statistics

Temporal stability [1/decade]:


abs

rel


Weighted least square:

0.19955567279


Ordinary least square:

0.0616491601803


Probabilities that GCOS criteria is met:

Weighted least square:

4.3 %

Ordinary least square:

2.0 %


+057/+063 deg (BHR)


BHR statistics

Temporal stability [1/decade]:


abs

rel


Weighted least square:

0.0125580549582


Ordinary least square:

-0.00524176941785


Probabilities that GCOS criteria is met:

Weighted least square:

4.1 %

Ordinary least square:

4.9 %


DHR statistics

Temporal stability [1/decade]:


abs

rel


Weighted least square:

0.0494996084051


Ordinary least square:

0.00536935073967


Probabilities that GCOS criteria is met:

Weighted least square:

0.0 %

Ordinary least square:

4.8 %


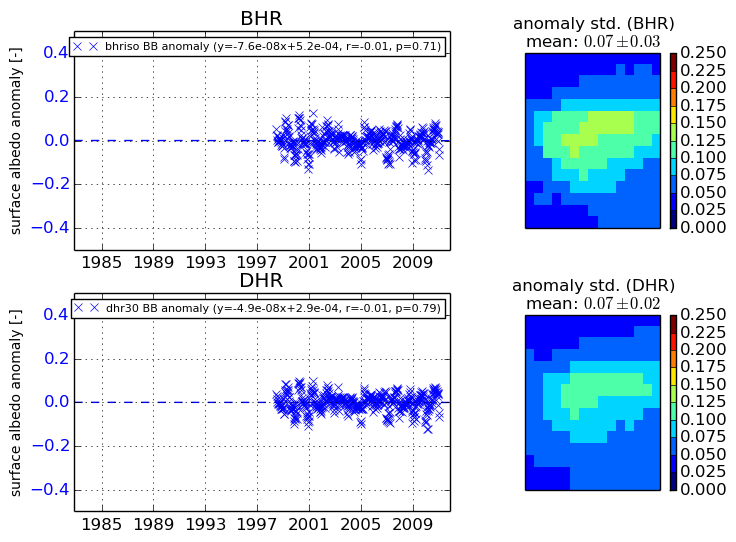
Temporal anomaly analyis

The variance of the temporal anomalies provides an additional measure about the stability of the signal AFTER removal of the mean seasonal cylce.
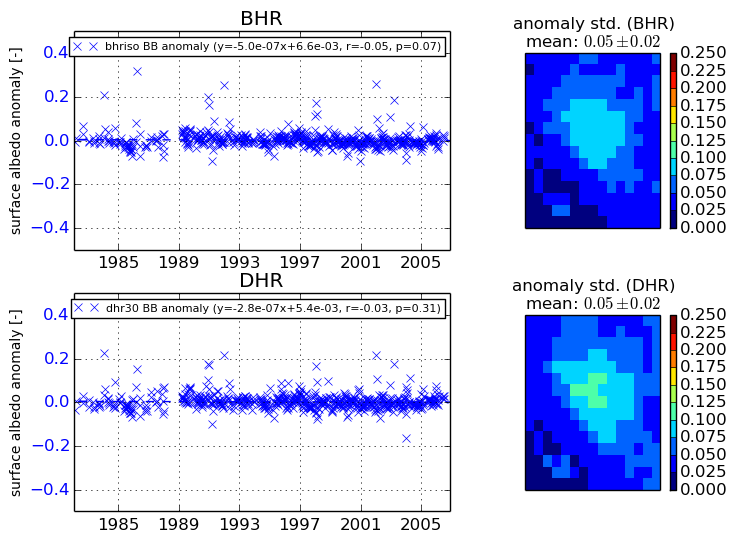
+000 deg


+057/+063 deg