SANTA_BARBARA_COASTAL_LTER_SBC


Location

lon / lat [deg]: -119.84 / 34.41

Source network: LTER


Geostationary surface albedo (GSA) data


“+000”


“+057/+063”


Landcover information (based on ESA CCI landcover data)


Landcover fractions @ 2km distance


Landcover fractions @ 20 km distance


Legend


Distance to open water bodies [km]:

0.04

Distance to urban areas [km]:

0.28


Radius: 1 km

Number of landcover classes:

2

Dominant landcover type:

210: water bodies

Fraction of dominant landcover type [%]:

62.0


Radius: 2 km

Number of landcover classes:

2

Dominant landcover type:

210: water bodies

Fraction of dominant landcover type [%]:

57.0


Radius: 5 km

Number of landcover classes:

4

Dominant landcover type:

210: water bodies

Fraction of dominant landcover type [%]:

55.0


Radius: 10 km

Number of landcover classes:

6

Dominant landcover type:

210: water bodies

Fraction of dominant landcover type [%]:

55.0


Radius: 20 km

Number of landcover classes:

6

Dominant landcover type:

210: water bodies

Fraction of dominant landcover type [%]:

55.0


Disturbances


Heterogeneity analysis

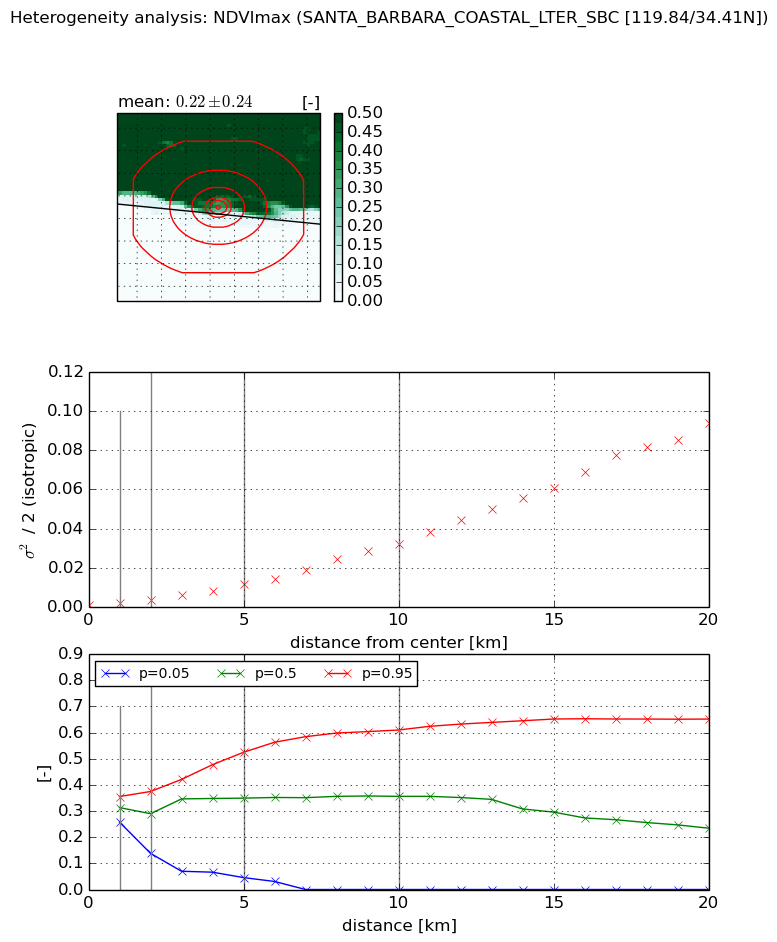
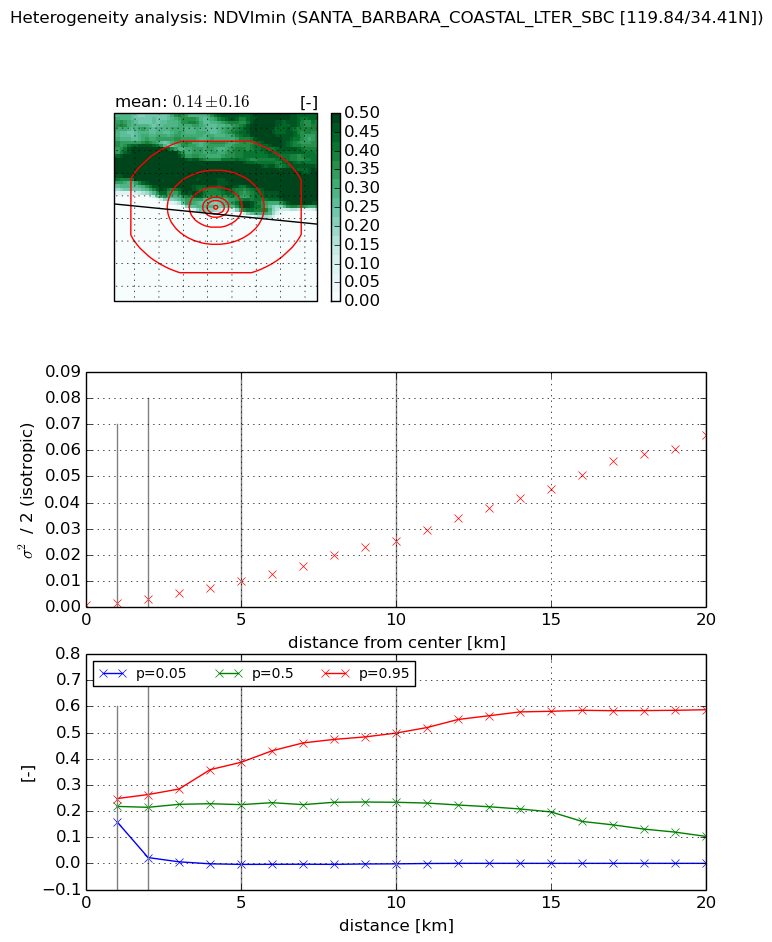
The heterogeneity analysis provides information about the spatial and temporal heterogeneity of the site.

Topography


Roman et al. (2009) index


St

nan

Rcv

nan

Rse

nan

Rst

nan

Rsv

nan


Height range @ 1km [m]

21

Height range @ 2km [m]

20

Height range @ 5km [m]

33

Height range @ 10km [m]

-999

Height range @ 20km [m]

-999


Variance slope @ 1 km

167

Variance slope @ 2 km

159

Variance slope @ 5 km

139

Variance slope @ 10 km

-999

Variance slope @ 20 km

-999


NDVI (max. NDVI composite)


Roman et al. (2009) index


St

1.70530788694

Rcv

0.473863231318

Rse

0.0

Rst

-0.285349943959

Rsv

-0.999999939833


NDVI range @ 1km [-]

0.1

NDVI range @ 2km [-]

0.24

NDVI range @ 5km [-]

0.48

NDVI range @ 10km [-]

0.61

NDVI range @ 20km [-]

0.65


Variance slope @ 1 km

0.00097452719322

Variance slope @ 2 km

0.00131007854087

Variance slope @ 5 km

0.00215750446222

Variance slope @ 10 km

0.00326293321325

Variance slope @ 20 km

0.00483276200485


NDVI (min. NDVI composite)I


Roman et al. (2009) index


St

1.92748286163

Rcv

0.392709955305

Rse

0.0

Rst

-0.163724281251

Rsv

-0.999999835946


NDVI range @ 1km [-]

0.09

NDVI range @ 2km [-]

0.24

NDVI range @ 5km [-]

0.39

NDVI range @ 10km [-]

0.5

NDVI range @ 20km [-]

0.59


NDVI slope @ 1 km

0.000837341991253

NDVI slope @ 2 km

0.00112866039203

NDVI slope @ 5 km

0.00188869507458

NDVI slope @ 10 km

0.00259774850635

NDVI slope @ 20 km

0.00341845148472


Temporal stability analysis

+000 deg (BHR)


BHR statistics

Temporal stability [1/decade]:


abs

rel


Weighted least square:

None


Ordinary least square:

None


Probabilities that GCOS criteria is met:

Weighted least square:

None %

Ordinary least square:

None %


DHR statistics

Temporal stability [1/decade]:


abs

rel


Weighted least square:

None


Ordinary least square:

None


Probabilities that GCOS criteria is met:

Weighted least square:

None %

Ordinary least square:

None %


+057/+063 deg (BHR)


BHR statistics

Temporal stability [1/decade]:


abs

rel


Weighted least square:

None


Ordinary least square:

None


Probabilities that GCOS criteria is met:

Weighted least square:

None %

Ordinary least square:

None %


DHR statistics

Temporal stability [1/decade]:


abs

rel


Weighted least square:

None


Ordinary least square:

None


Probabilities that GCOS criteria is met:

Weighted least square:

None %

Ordinary least square:

None %


Temporal anomaly analyis

The variance of the temporal anomalies provides an additional measure about the stability of the signal AFTER removal of the mean seasonal cylce.

+000 deg


+057/+063 deg