SANTA_CRUZ_UTEPSA


Location

lon / lat [deg]: -63.201 / -17.7673

Source network: AERONET


Geostationary surface albedo (GSA) data


“+000”


“+057/+063”


Landcover information (based on ESA CCI landcover data)


Landcover fractions @ 2km distance


Landcover fractions @ 20 km distance


Legend


Distance to open water bodies [km]:

0.96

Distance to urban areas [km]:

0.09


Radius: 1 km

Number of landcover classes:

5

Dominant landcover type:

190: urban areas

Fraction of dominant landcover type [%]:

85.0


Radius: 2 km

Number of landcover classes:

8

Dominant landcover type:

190: urban areas

Fraction of dominant landcover type [%]:

79.0


Radius: 5 km

Number of landcover classes:

6

Dominant landcover type:

190: urban areas

Fraction of dominant landcover type [%]:

65.0


Radius: 10 km

Number of landcover classes:

8

Dominant landcover type:

190: urban areas

Fraction of dominant landcover type [%]:

53.0


Radius: 20 km

Number of landcover classes:

8

Dominant landcover type:

10: cropland, rainfed

Fraction of dominant landcover type [%]:

40.0


Disturbances


Heterogeneity analysis

The heterogeneity analysis provides information about the spatial and temporal heterogeneity of the site.

Topography


Roman et al. (2009) index


St

2.15713578002

Rcv

0.386663634546

Rse

0.0

Rst

0.00406952741312

Rsv

-0.999999877559


Height range @ 1km [m]

7

Height range @ 2km [m]

12

Height range @ 5km [m]

29

Height range @ 10km [m]

-999

Height range @ 20km [m]

-999


Variance slope @ 1 km

19

Variance slope @ 2 km

16

Variance slope @ 5 km

15

Variance slope @ 10 km

-999

Variance slope @ 20 km

-999


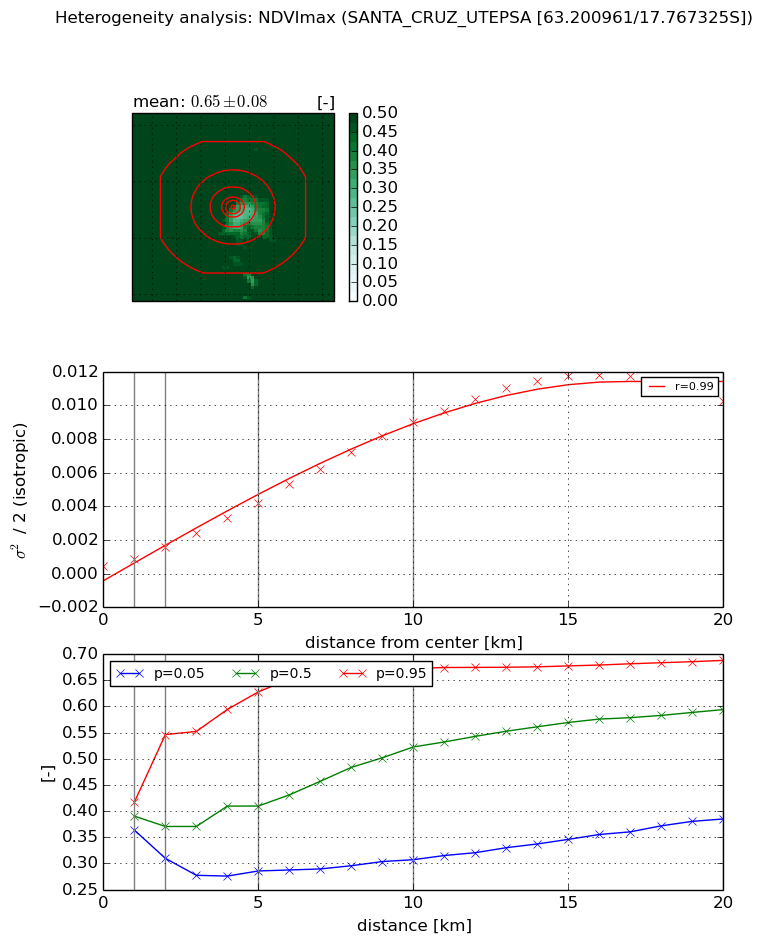
NDVI (max. NDVI composite)


Roman et al. (2009) index


St

3.47638526269

Rcv

0.113120917093

Rse

0.0

Rst

-2.24495696476e-08

Rsv

-0.749844403278


NDVI range @ 1km [-]

0.05

NDVI range @ 2km [-]

0.24

NDVI range @ 5km [-]

0.34

NDVI range @ 10km [-]

0.37

NDVI range @ 20km [-]

0.3


Variance slope @ 1 km

0.000407833162326

Variance slope @ 2 km

0.000563736417069

Variance slope @ 5 km

0.000772169785552

Variance slope @ 10 km

0.000898329332902

Variance slope @ 20 km

0.000608662160777


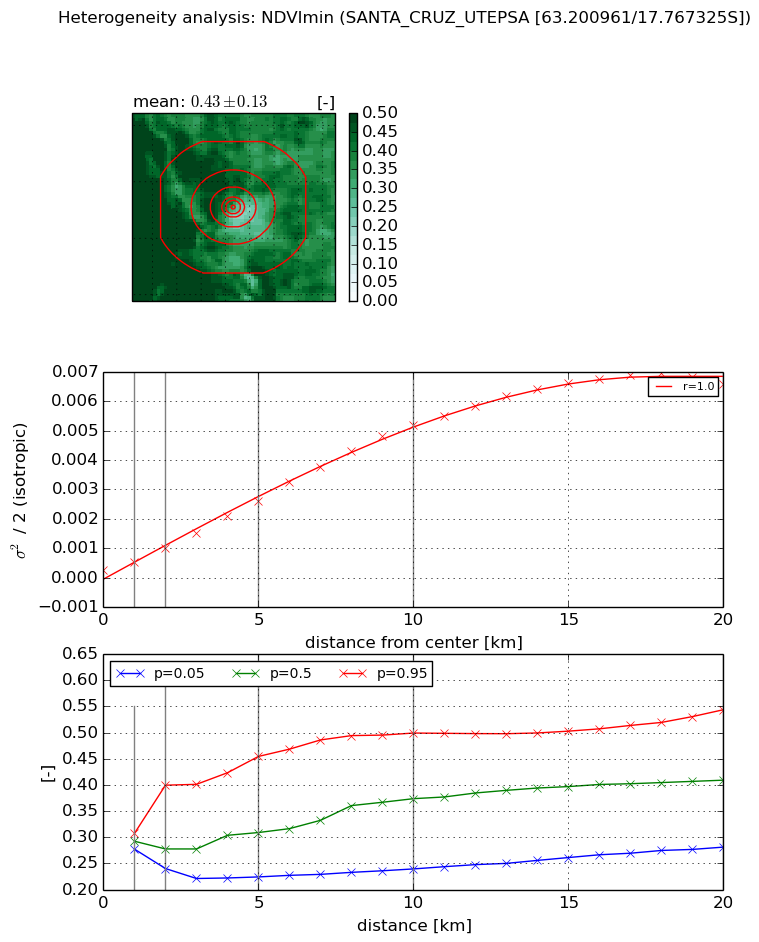
NDVI (min. NDVI composite)I


Roman et al. (2009) index


St

7.30446035183

Rcv

0.133660771019

Rse

0.0

Rst

-2.29870630587e-08

Rsv

-0.277047164625


NDVI range @ 1km [-]

0.03

NDVI range @ 2km [-]

0.16

NDVI range @ 5km [-]

0.23

NDVI range @ 10km [-]

0.26

NDVI range @ 20km [-]

0.26


NDVI slope @ 1 km

0.000258814613099

NDVI slope @ 2 km

0.000359109393037

NDVI slope @ 5 km

0.000480053591767

NDVI slope @ 10 km

0.000520453669745

NDVI slope @ 20 km

0.000359637915823


Temporal stability analysis

+000 deg (BHR)


BHR statistics

Temporal stability [1/decade]:


abs

rel


Weighted least square:

-99999.0


Ordinary least square:

-99999.0


Probabilities that GCOS criteria is met:

Weighted least square:

-99999.0 %

Ordinary least square:

-99999.0 %


DHR statistics

Temporal stability [1/decade]:


abs

rel


Weighted least square:

-99999.0


Ordinary least square:

-99999.0


Probabilities that GCOS criteria is met:

Weighted least square:

-99999.0 %

Ordinary least square:

-99999.0 %


+057/+063 deg (BHR)


BHR statistics

Temporal stability [1/decade]:


abs

rel


Weighted least square:

None


Ordinary least square:

None


Probabilities that GCOS criteria is met:

Weighted least square:

None %

Ordinary least square:

None %


DHR statistics

Temporal stability [1/decade]:


abs

rel


Weighted least square:

None


Ordinary least square:

None


Probabilities that GCOS criteria is met:

Weighted least square:

None %

Ordinary least square:

None %


Temporal anomaly analyis

The variance of the temporal anomalies provides an additional measure about the stability of the signal AFTER removal of the mean seasonal cylce.

+000 deg


+057/+063 deg