SANTIAGO_BEAUCHEF


Location

lon / lat [deg]: -70.6617 / -33.4572

Source network: AERONET


Geostationary surface albedo (GSA) data


“+000”


“+057/+063”


Landcover information (based on ESA CCI landcover data)


Landcover fractions @ 2km distance


Landcover fractions @ 20 km distance


Legend


Distance to open water bodies [km]:

15.47

Distance to urban areas [km]:

0.08


Radius: 1 km

Number of landcover classes:

1

Dominant landcover type:

190: urban areas

Fraction of dominant landcover type [%]:

100.0


Radius: 2 km

Number of landcover classes:

1

Dominant landcover type:

190: urban areas

Fraction of dominant landcover type [%]:

100.0


Radius: 5 km

Number of landcover classes:

1

Dominant landcover type:

190: urban areas

Fraction of dominant landcover type [%]:

100.0


Radius: 10 km

Number of landcover classes:

2

Dominant landcover type:

190: urban areas

Fraction of dominant landcover type [%]:

98.0


Radius: 20 km

Number of landcover classes:

4

Dominant landcover type:

190: urban areas

Fraction of dominant landcover type [%]:

53.0


Disturbances


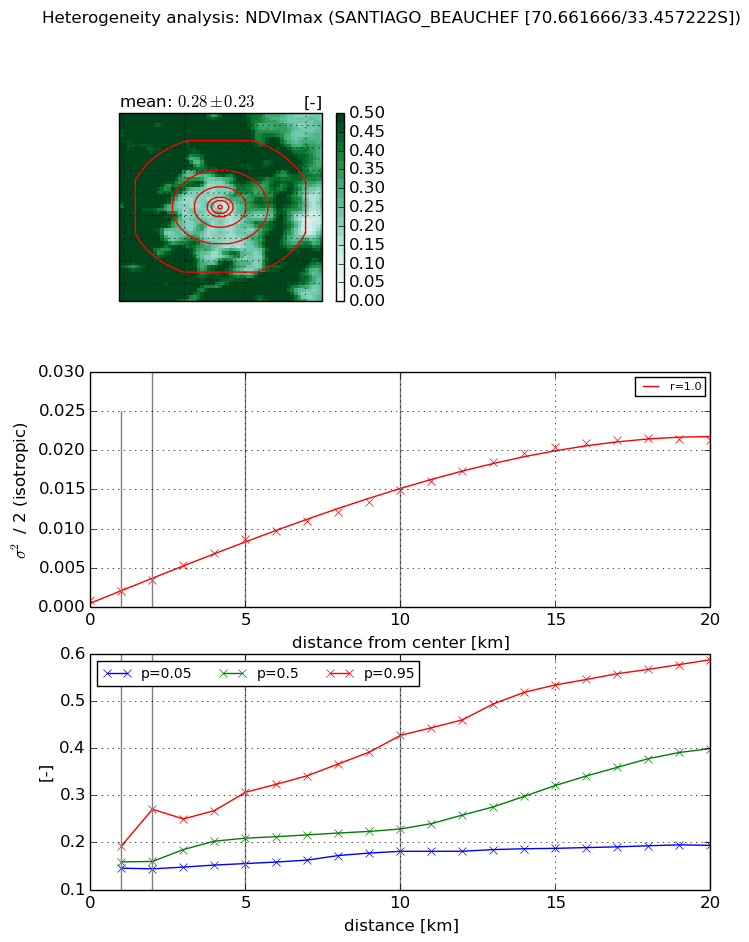
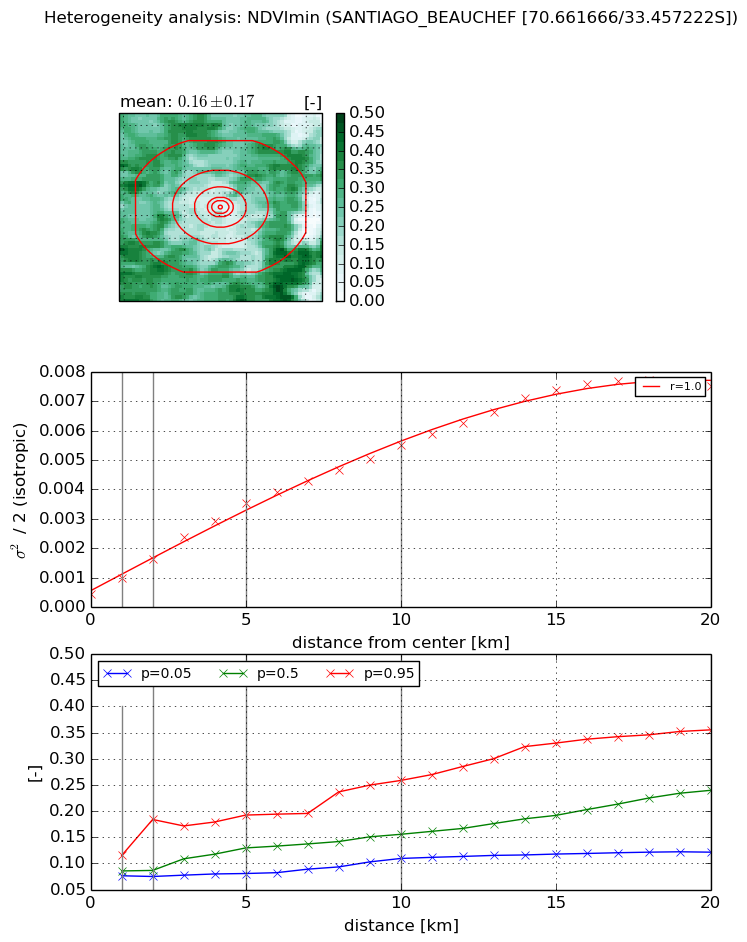
Heterogeneity analysis

The heterogeneity analysis provides information about the spatial and temporal heterogeneity of the site.

Topography


Roman et al. (2009) index


St

1.56009952254

Rcv

0.938758936815

Rse

0.0

Rst

-6.66915602147e-06

Rsv

-0.98418863935


Height range @ 1km [m]

20

Height range @ 2km [m]

38

Height range @ 5km [m]

82

Height range @ 10km [m]

-999

Height range @ 20km [m]

-999


Variance slope @ 1 km

406

Variance slope @ 2 km

253

Variance slope @ 5 km

195

Variance slope @ 10 km

-999

Variance slope @ 20 km

-999


NDVI (max. NDVI composite)


Roman et al. (2009) index


St

1.80612354985

Rcv

0.176589489862

Rse

0.0

Rst

-0.48442695008

Rsv

-0.999999496786


NDVI range @ 1km [-]

0.05

NDVI range @ 2km [-]

0.13

NDVI range @ 5km [-]

0.15

NDVI range @ 10km [-]

0.25

NDVI range @ 20km [-]

0.39


Variance slope @ 1 km

0.00119197711689

Variance slope @ 2 km

0.00129777855093

Variance slope @ 5 km

0.00157410017469

Variance slope @ 10 km

0.00141041272094

Variance slope @ 20 km

0.00110722955226


NDVI (min. NDVI composite)I


Roman et al. (2009) index


St

8.31942046275

Rcv

-0.0110241038233

Rse

0.0

Rst

-0.0823006406252

Rsv

0.267277296695


NDVI range @ 1km [-]

0.04

NDVI range @ 2km [-]

0.11

NDVI range @ 5km [-]

0.11

NDVI range @ 10km [-]

0.15

NDVI range @ 20km [-]

0.23


NDVI slope @ 1 km

0.000565952791635

NDVI slope @ 2 km

0.000594853122703

NDVI slope @ 5 km

0.000628097005842

NDVI slope @ 10 km

0.000504148133146

NDVI slope @ 20 km

0.000373949043362


Temporal stability analysis

+000 deg (BHR)


BHR statistics

Temporal stability [1/decade]:


abs

rel


Weighted least square:

-99999.0


Ordinary least square:

-99999.0


Probabilities that GCOS criteria is met:

Weighted least square:

-99999.0 %

Ordinary least square:

-99999.0 %


DHR statistics

Temporal stability [1/decade]:


abs

rel


Weighted least square:

-99999.0


Ordinary least square:

-99999.0


Probabilities that GCOS criteria is met:

Weighted least square:

-99999.0 %

Ordinary least square:

-99999.0 %


+057/+063 deg (BHR)


BHR statistics

Temporal stability [1/decade]:


abs

rel


Weighted least square:

None


Ordinary least square:

None


Probabilities that GCOS criteria is met:

Weighted least square:

None %

Ordinary least square:

None %


DHR statistics

Temporal stability [1/decade]:


abs

rel


Weighted least square:

None


Ordinary least square:

None


Probabilities that GCOS criteria is met:

Weighted least square:

None %

Ordinary least square:

None %


Temporal anomaly analyis

The variance of the temporal anomalies provides an additional measure about the stability of the signal AFTER removal of the mean seasonal cylce.

+000 deg


+057/+063 deg