SAO_MARTINHO_SONDA


Location

lon / lat [deg]: -53.8234 / -29.4433

Source network: AERONET


Geostationary surface albedo (GSA) data


“+000”


“+057/+063”


Landcover information (based on ESA CCI landcover data)


Landcover fractions @ 2km distance


Landcover fractions @ 20 km distance


Legend


Distance to open water bodies [km]:

9.32

Distance to urban areas [km]:

9.76


Radius: 1 km

Number of landcover classes:

2

Dominant landcover type:

10: cropland, rainfed

Fraction of dominant landcover type [%]:

92.0


Radius: 2 km

Number of landcover classes:

2

Dominant landcover type:

10: cropland, rainfed

Fraction of dominant landcover type [%]:

85.0


Radius: 5 km

Number of landcover classes:

3

Dominant landcover type:

10: cropland, rainfed

Fraction of dominant landcover type [%]:

88.0


Radius: 10 km

Number of landcover classes:

5

Dominant landcover type:

10: cropland, rainfed

Fraction of dominant landcover type [%]:

77.0


Radius: 20 km

Number of landcover classes:

6

Dominant landcover type:

10: cropland, rainfed

Fraction of dominant landcover type [%]:

61.0


Disturbances


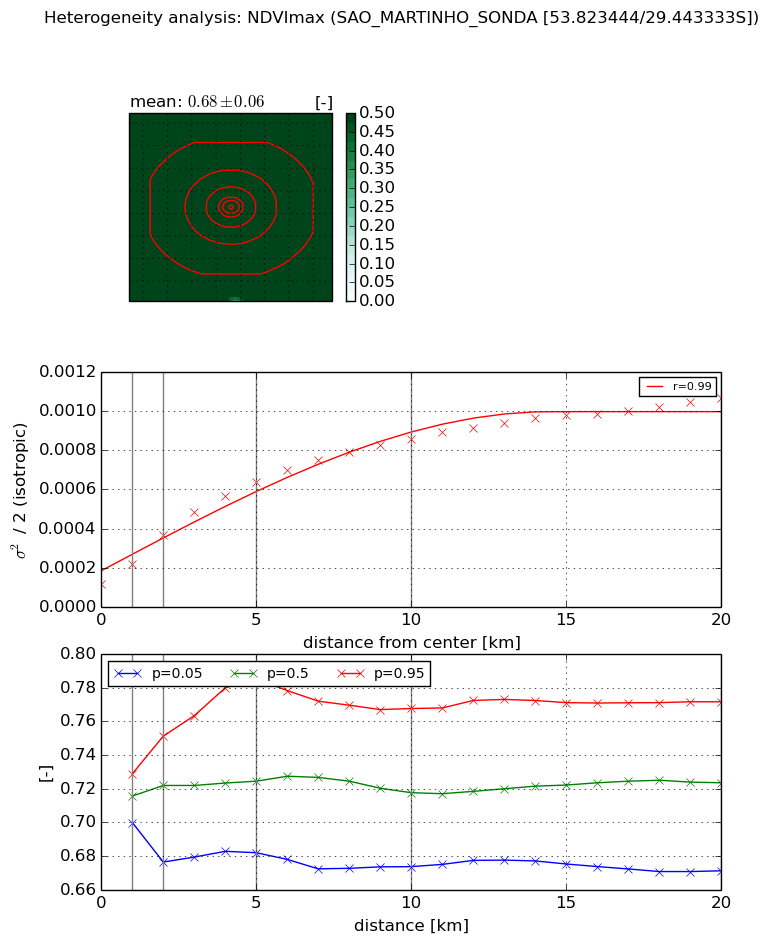
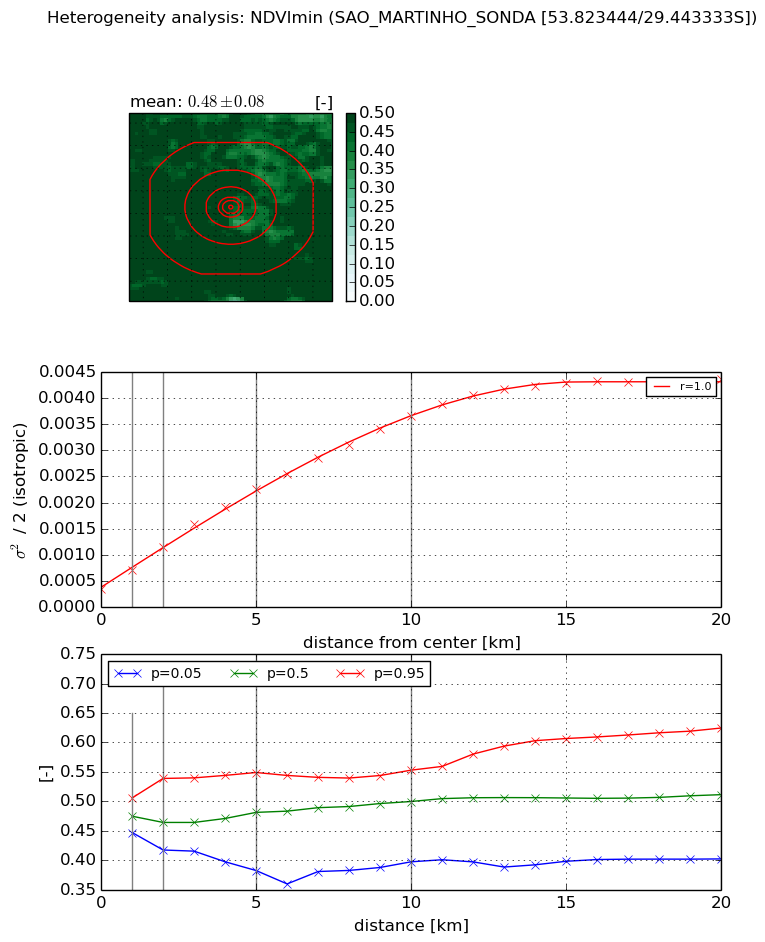
Heterogeneity analysis

The heterogeneity analysis provides information about the spatial and temporal heterogeneity of the site.

Topography


Roman et al. (2009) index


St

1.78804618477e-06

Rcv

0.203273186768

Rse

0.0

Rst

-0.00498143161016

Rsv

1677808.80225


Height range @ 1km [m]

41

Height range @ 2km [m]

61

Height range @ 5km [m]

92

Height range @ 10km [m]

-999

Height range @ 20km [m]

-999


Variance slope @ 1 km

201

Variance slope @ 2 km

181

Variance slope @ 5 km

155

Variance slope @ 10 km

-999

Variance slope @ 20 km

-999


NDVI (max. NDVI composite)


Roman et al. (2009) index


St

7.41631073656

Rcv

0.0389218231798

Rse

0.0

Rst

-0.110039943341

Rsv

0.255552028352


NDVI range @ 1km [-]

0.03

NDVI range @ 2km [-]

0.07

NDVI range @ 5km [-]

0.1

NDVI range @ 10km [-]

0.09

NDVI range @ 20km [-]

0.1


Variance slope @ 1 km

0.000104306202529

Variance slope @ 2 km

0.000124860173948

Variance slope @ 5 km

0.000107362498835

Variance slope @ 10 km

7.30487263831e-05

Variance slope @ 20 km

4.14410881559e-05


NDVI (min. NDVI composite)I


Roman et al. (2009) index


St

2.56624682287

Rcv

0.12913626969

Rse

0.0

Rst

0.012855466104

Rsv

1.02703065646


NDVI range @ 1km [-]

0.06

NDVI range @ 2km [-]

0.12

NDVI range @ 5km [-]

0.17

NDVI range @ 10km [-]

0.16

NDVI range @ 20km [-]

0.22


NDVI slope @ 1 km

0.000366078382888

NDVI slope @ 2 km

0.000400151424608

NDVI slope @ 5 km

0.000389649345002

NDVI slope @ 10 km

0.000330463545233

NDVI slope @ 20 km

0.000200403156038


Temporal stability analysis

+000 deg (BHR)


BHR statistics

Temporal stability [1/decade]:


abs

rel


Weighted least square:

-99999.0


Ordinary least square:

-99999.0


Probabilities that GCOS criteria is met:

Weighted least square:

-99999.0 %

Ordinary least square:

-99999.0 %


DHR statistics

Temporal stability [1/decade]:


abs

rel


Weighted least square:

-99999.0


Ordinary least square:

-99999.0


Probabilities that GCOS criteria is met:

Weighted least square:

-99999.0 %

Ordinary least square:

-99999.0 %


+057/+063 deg (BHR)


BHR statistics

Temporal stability [1/decade]:


abs

rel


Weighted least square:

None


Ordinary least square:

None


Probabilities that GCOS criteria is met:

Weighted least square:

None %

Ordinary least square:

None %


DHR statistics

Temporal stability [1/decade]:


abs

rel


Weighted least square:

None


Ordinary least square:

None


Probabilities that GCOS criteria is met:

Weighted least square:

None %

Ordinary least square:

None %


Temporal anomaly analyis

The variance of the temporal anomalies provides an additional measure about the stability of the signal AFTER removal of the mean seasonal cylce.

+000 deg


+057/+063 deg