SBO


Location

lon / lat [deg]: 34.7794 / 30.8597

Source network: BSRN


Geostationary surface albedo (GSA) data


“+000”


“+057/+063”


Landcover information (based on ESA CCI landcover data)


Landcover fractions @ 2km distance


Landcover fractions @ 20 km distance


Legend


Distance to open water bodies [km]:

16.32

Distance to urban areas [km]:

13.33


Radius: 1 km

Number of landcover classes:

1

Dominant landcover type:

200: bare areas

Fraction of dominant landcover type [%]:

100.0


Radius: 2 km

Number of landcover classes:

1

Dominant landcover type:

200: bare areas

Fraction of dominant landcover type [%]:

100.0


Radius: 5 km

Number of landcover classes:

1

Dominant landcover type:

200: bare areas

Fraction of dominant landcover type [%]:

99.0


Radius: 10 km

Number of landcover classes:

1

Dominant landcover type:

200: bare areas

Fraction of dominant landcover type [%]:

99.0


Radius: 20 km

Number of landcover classes:

1

Dominant landcover type:

200: bare areas

Fraction of dominant landcover type [%]:

99.0


Disturbances


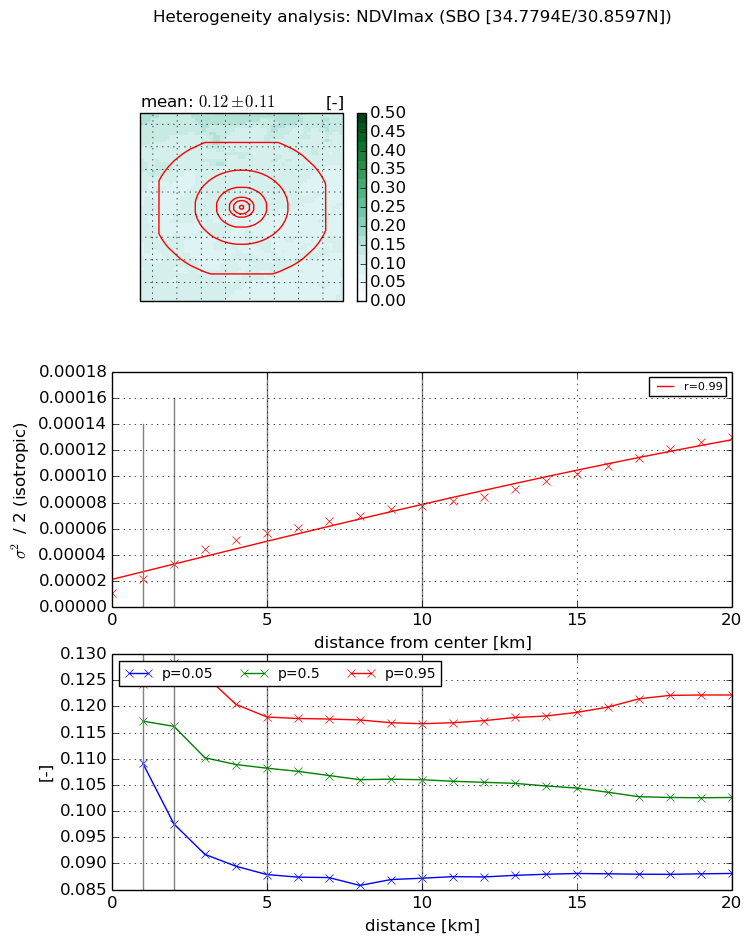
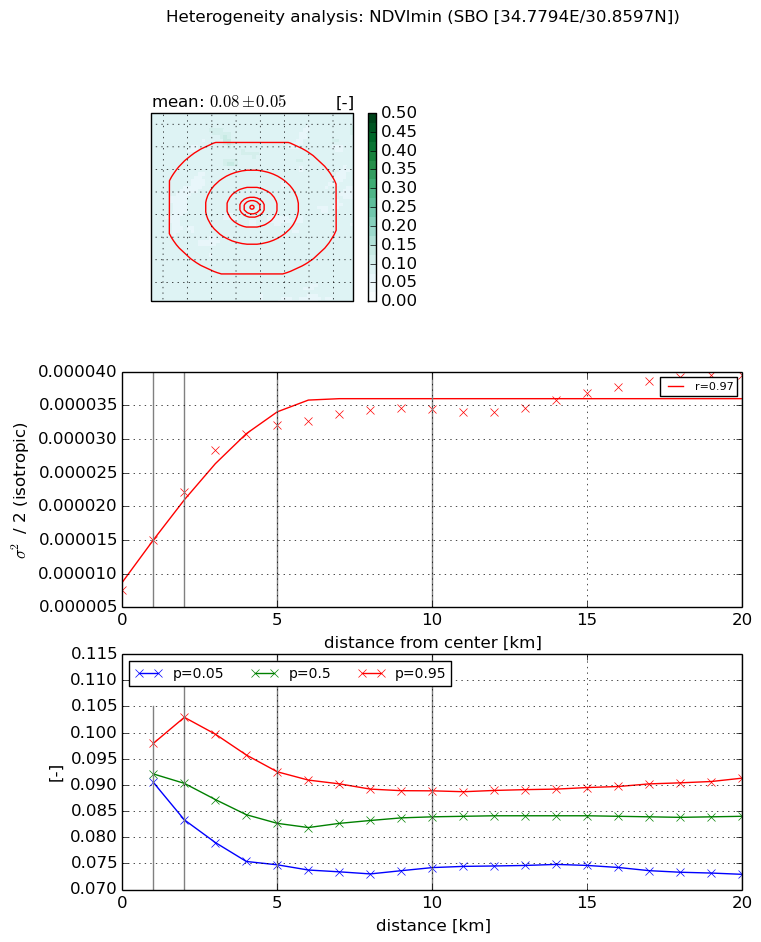
Heterogeneity analysis

The heterogeneity analysis provides information about the spatial and temporal heterogeneity of the site.

Topography


Roman et al. (2009) index


St

10.2461256261

Rcv

0.126672228442

Rse

0.0

Rst

-0.0383132880569

Rsv

0.127808082707


Height range @ 1km [m]

35

Height range @ 2km [m]

153

Height range @ 5km [m]

182

Height range @ 10km [m]

-999

Height range @ 20km [m]

-999


Variance slope @ 1 km

1104

Variance slope @ 2 km

1107

Variance slope @ 5 km

712

Variance slope @ 10 km

-999

Variance slope @ 20 km

-999


NDVI (max. NDVI composite)


Roman et al. (2009) index


St

5.37483392058

Rcv

0.0533507459323

Rse

0.0

Rst

-0.462541443075

Rsv

0.0422645920821


NDVI range @ 1km [-]

0.02

NDVI range @ 2km [-]

0.03

NDVI range @ 5km [-]

0.03

NDVI range @ 10km [-]

0.03

NDVI range @ 20km [-]

0.03


Variance slope @ 1 km

1.06327697433e-05

Variance slope @ 2 km

1.10898752595e-05

Variance slope @ 5 km

9.37890537786e-06

Variance slope @ 10 km

6.44650621169e-06

Variance slope @ 20 km

5.38522993733e-06


NDVI (min. NDVI composite)I


Roman et al. (2009) index


St

1.44280964186

Rcv

0.0292611649415

Rse

0.0

Rst

-0.4363254896

Rsv

1.61368971912


NDVI range @ 1km [-]

0.01

NDVI range @ 2km [-]

0.02

NDVI range @ 5km [-]

0.02

NDVI range @ 10km [-]

0.01

NDVI range @ 20km [-]

0.02


NDVI slope @ 1 km

7.31284750328e-06

NDVI slope @ 2 km

7.26860404452e-06

NDVI slope @ 5 km

5.02881965509e-06

NDVI slope @ 10 km

2.38412535309e-06

NDVI slope @ 20 km

1.07852281794e-06


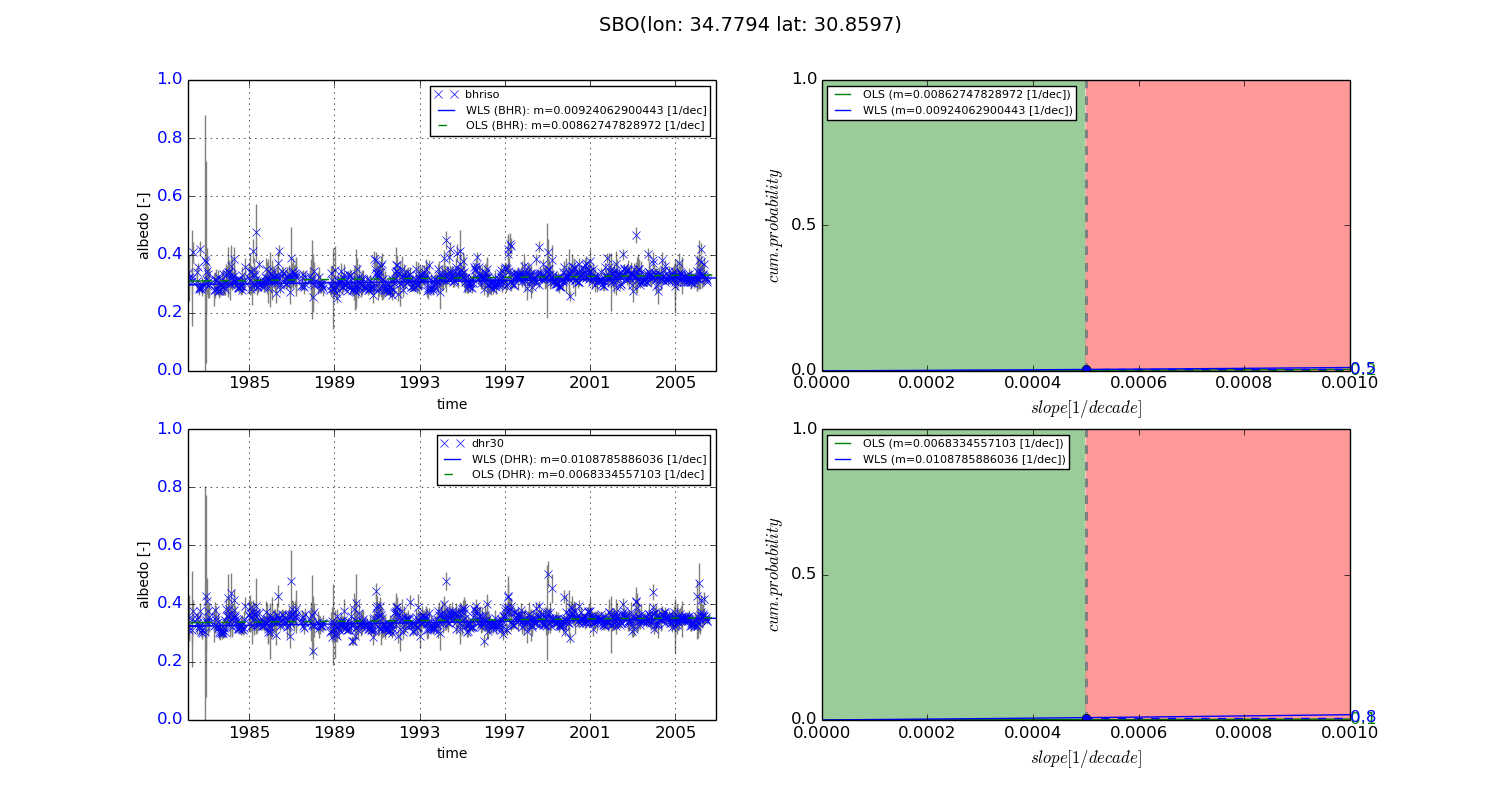
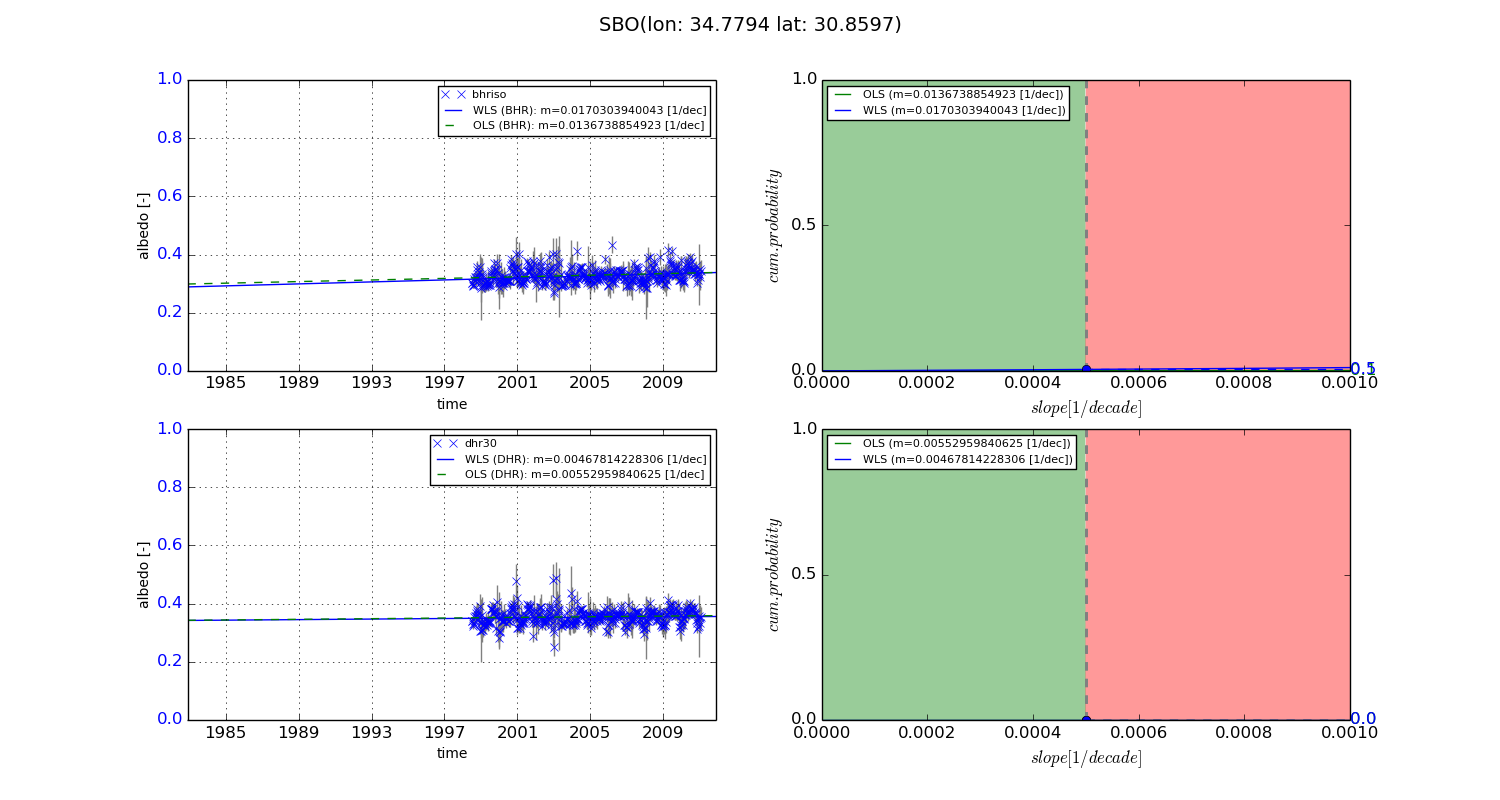
Temporal stability analysis

+000 deg (BHR)


BHR statistics

Temporal stability [1/decade]:


abs

rel


Weighted least square:

0.00924062900443


Ordinary least square:

0.00862747828972


Probabilities that GCOS criteria is met:

Weighted least square:

0.5 %

Ordinary least square:

0.2 %


DHR statistics

Temporal stability [1/decade]:


abs

rel


Weighted least square:

0.0108785886036


Ordinary least square:

0.0068334557103


Probabilities that GCOS criteria is met:

Weighted least square:

0.8 %

Ordinary least square:

0.1 %


+057/+063 deg (BHR)


BHR statistics

Temporal stability [1/decade]:


abs

rel


Weighted least square:

0.0170303940043


Ordinary least square:

0.0136738854923


Probabilities that GCOS criteria is met:

Weighted least square:

0.5 %

Ordinary least square:

0.1 %


DHR statistics

Temporal stability [1/decade]:


abs

rel


Weighted least square:

0.00467814228306


Ordinary least square:

0.00552959840625


Probabilities that GCOS criteria is met:

Weighted least square:

0.0 %

Ordinary least square:

0.0 %


Temporal anomaly analyis

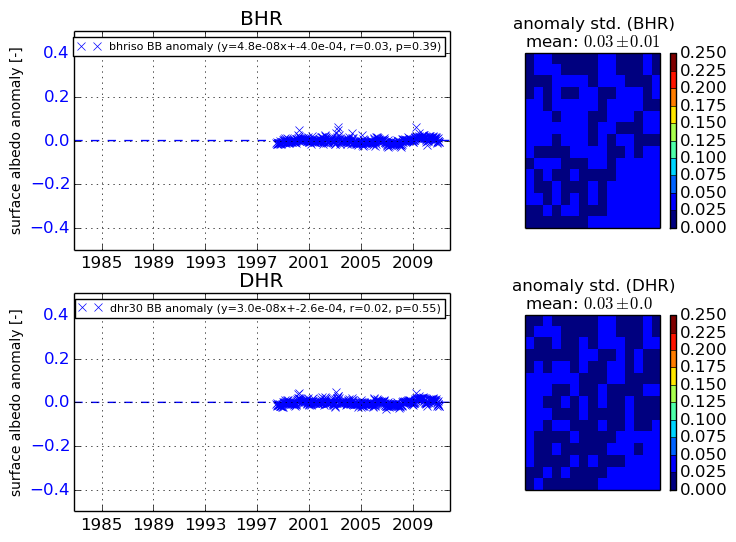
The variance of the temporal anomalies provides an additional measure about the stability of the signal AFTER removal of the mean seasonal cylce.
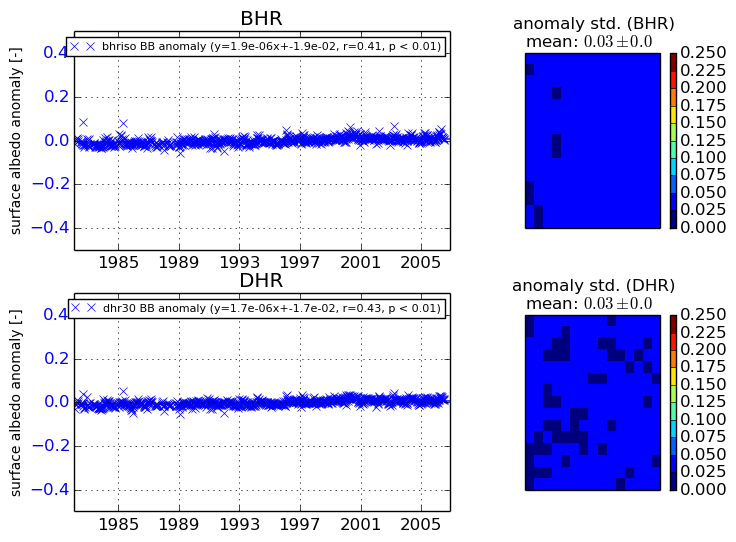
+000 deg


+057/+063 deg