SE-DEG


Location

lon / lat [deg]: 19.55 / 64.1833

Source network: FLUXNET


Geostationary surface albedo (GSA) data


“+000”


“+057/+063”


Landcover information (based on ESA CCI landcover data)


Landcover fractions @ 2km distance


Landcover fractions @ 20 km distance


Legend


Distance to open water bodies [km]:

3.35

Distance to urban areas [km]:

7.35


Radius: 1 km

Number of landcover classes:

3

Dominant landcover type:

180: shrub or herbaceous cover, flooded, fresh/saline/brakish water

Fraction of dominant landcover type [%]:

49.0


Radius: 2 km

Number of landcover classes:

3

Dominant landcover type:

70: Tree cover, needleleaved, evergreen, closed to open (>15%)

Fraction of dominant landcover type [%]:

80.0


Radius: 5 km

Number of landcover classes:

5

Dominant landcover type:

70: Tree cover, needleleaved, evergreen, closed to open (>15%)

Fraction of dominant landcover type [%]:

89.0


Radius: 10 km

Number of landcover classes:

6

Dominant landcover type:

70: Tree cover, needleleaved, evergreen, closed to open (>15%)

Fraction of dominant landcover type [%]:

89.0


Radius: 20 km

Number of landcover classes:

5

Dominant landcover type:

70: Tree cover, needleleaved, evergreen, closed to open (>15%)

Fraction of dominant landcover type [%]:

90.0


Disturbances


Heterogeneity analysis

The heterogeneity analysis provides information about the spatial and temporal heterogeneity of the site.

Topography


Roman et al. (2009) index


St

16.7317635652

Rcv

0.0738592954117

Rse

0.0

Rst

0.00892589547729

Rsv

0.0965144978921


Height range @ 1km [m]

8

Height range @ 2km [m]

121

Height range @ 5km [m]

136

Height range @ 10km [m]

-999

Height range @ 20km [m]

-999


Variance slope @ 1 km

588

Variance slope @ 2 km

673

Variance slope @ 5 km

537

Variance slope @ 10 km

-999

Variance slope @ 20 km

-999


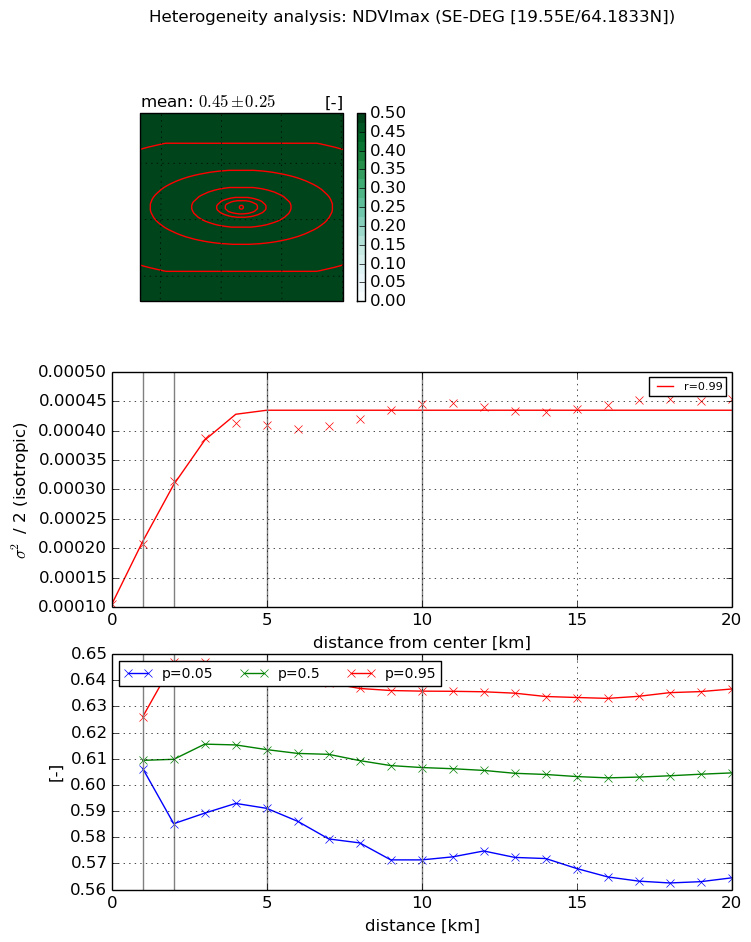
NDVI (max. NDVI composite)


Roman et al. (2009) index


St

14.6723765817

Rcv

-0.174322896729

Rse

0.0

Rst

0.0195805370962

Rsv

0.0105624196305


NDVI range @ 1km [-]

0.02

NDVI range @ 2km [-]

0.06

NDVI range @ 5km [-]

0.05

NDVI range @ 10km [-]

0.06

NDVI range @ 20km [-]

0.07


Variance slope @ 1 km

0.000102628817951

Variance slope @ 2 km

0.000105259423894

Variance slope @ 5 km

6.31381423835e-05

Variance slope @ 10 km

2.6904512458e-05

Variance slope @ 20 km

1.01468436672e-05


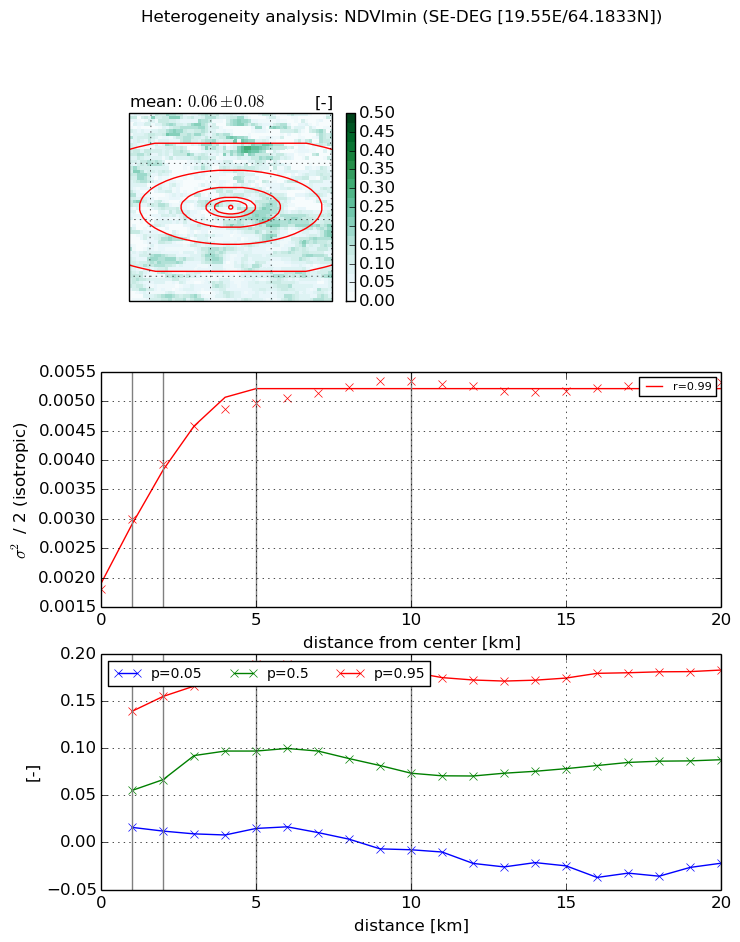
NDVI (min. NDVI composite)I


Roman et al. (2009) index


St

1.08335805536

Rcv

-0.00786234516919

Rse

0.0

Rst

-0.356727454959

Rsv

2.40457777578


NDVI range @ 1km [-]

0.12

NDVI range @ 2km [-]

0.14

NDVI range @ 5km [-]

0.17

NDVI range @ 10km [-]

0.19

NDVI range @ 20km [-]

0.21


NDVI slope @ 1 km

0.00118337725187

NDVI slope @ 2 km

0.0010613709954

NDVI slope @ 5 km

0.000631706945647

NDVI slope @ 10 km

0.000293911872403

NDVI slope @ 20 km

9.70263022974e-05


Temporal stability analysis

+000 deg (BHR)


BHR statistics

Temporal stability [1/decade]:


abs

rel


Weighted least square:

-99999.0


Ordinary least square:

-99999.0


Probabilities that GCOS criteria is met:

Weighted least square:

-99999.0 %

Ordinary least square:

-99999.0 %


DHR statistics

Temporal stability [1/decade]:


abs

rel


Weighted least square:

-99999.0


Ordinary least square:

-99999.0


Probabilities that GCOS criteria is met:

Weighted least square:

-99999.0 %

Ordinary least square:

-99999.0 %


+057/+063 deg (BHR)


BHR statistics

Temporal stability [1/decade]:


abs

rel


Weighted least square:

-99999.0


Ordinary least square:

-99999.0


Probabilities that GCOS criteria is met:

Weighted least square:

-99999.0 %

Ordinary least square:

-99999.0 %


DHR statistics

Temporal stability [1/decade]:


abs

rel


Weighted least square:

-99999.0


Ordinary least square:

-99999.0


Probabilities that GCOS criteria is met:

Weighted least square:

-99999.0 %

Ordinary least square:

-99999.0 %


Temporal anomaly analyis

The variance of the temporal anomalies provides an additional measure about the stability of the signal AFTER removal of the mean seasonal cylce.

+000 deg


+057/+063 deg