SE-NOR


Location

lon / lat [deg]: 17.4795 / 60.0865

Source network: FLUXNET


Geostationary surface albedo (GSA) data


“+000”


“+057/+063”


Landcover information (based on ESA CCI landcover data)


Landcover fractions @ 2km distance


Landcover fractions @ 20 km distance


Legend


Distance to open water bodies [km]:

1.15

Distance to urban areas [km]:

3.38


Radius: 1 km

Number of landcover classes:

1

Dominant landcover type:

70: Tree cover, needleleaved, evergreen, closed to open (>15%)

Fraction of dominant landcover type [%]:

100.0


Radius: 2 km

Number of landcover classes:

5

Dominant landcover type:

70: Tree cover, needleleaved, evergreen, closed to open (>15%)

Fraction of dominant landcover type [%]:

87.0


Radius: 5 km

Number of landcover classes:

5

Dominant landcover type:

70: Tree cover, needleleaved, evergreen, closed to open (>15%)

Fraction of dominant landcover type [%]:

76.0


Radius: 10 km

Number of landcover classes:

7

Dominant landcover type:

70: Tree cover, needleleaved, evergreen, closed to open (>15%)

Fraction of dominant landcover type [%]:

58.0


Radius: 20 km

Number of landcover classes:

6

Dominant landcover type:

70: Tree cover, needleleaved, evergreen, closed to open (>15%)

Fraction of dominant landcover type [%]:

55.0


Disturbances


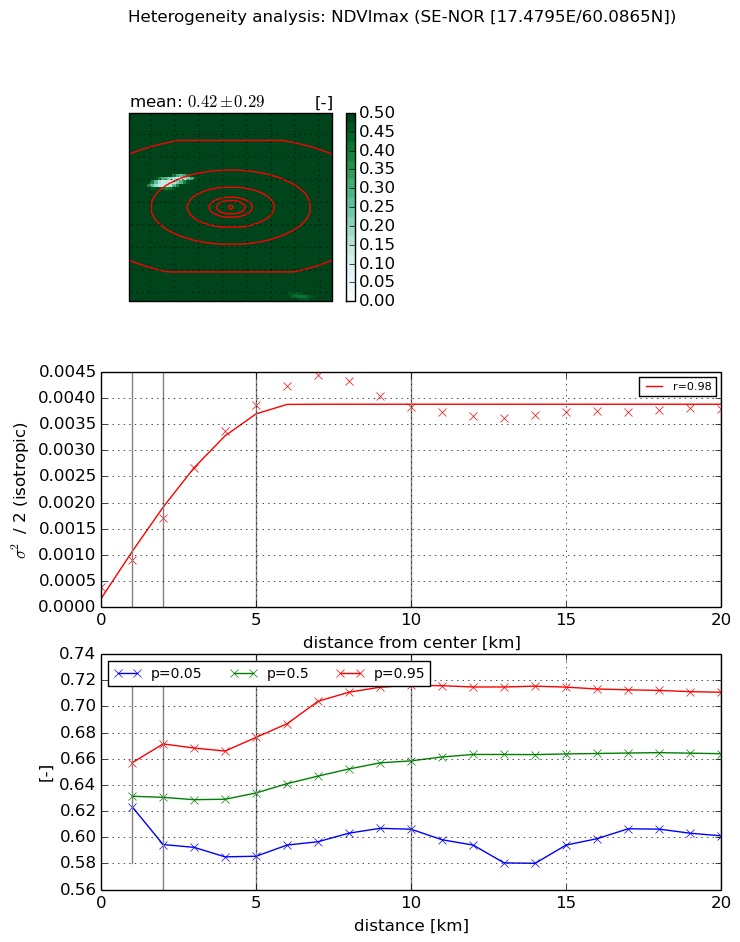
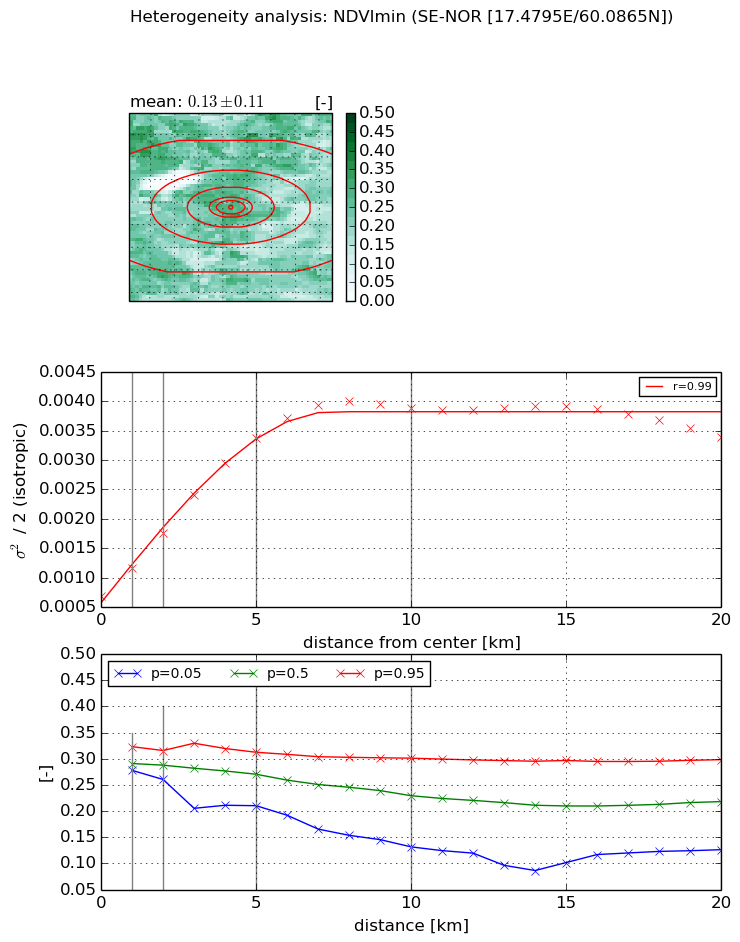
Heterogeneity analysis

The heterogeneity analysis provides information about the spatial and temporal heterogeneity of the site.

Topography


Roman et al. (2009) index


St

4.49325091086

Rcv

0.427549174616

Rse

0.0

Rst

-0.0028232070605

Rsv

-0.237295651897


Height range @ 1km [m]

11

Height range @ 2km [m]

14

Height range @ 5km [m]

28

Height range @ 10km [m]

-999

Height range @ 20km [m]

-999


Variance slope @ 1 km

25

Variance slope @ 2 km

19

Variance slope @ 5 km

14

Variance slope @ 10 km

-999

Variance slope @ 20 km

-999


NDVI (max. NDVI composite)


Roman et al. (2009) index


St

1.50490473695

Rcv

0.211268809401

Rse

0.0

Rst

-0.228138300803

Rsv

1.55407455434


NDVI range @ 1km [-]

0.03

NDVI range @ 2km [-]

0.08

NDVI range @ 5km [-]

0.09

NDVI range @ 10km [-]

0.11

NDVI range @ 20km [-]

0.11


Variance slope @ 1 km

0.000514603282776

Variance slope @ 2 km

0.000657060229281

Variance slope @ 5 km

0.000734898342604

Variance slope @ 10 km

0.00038264688694

Variance slope @ 20 km

0.000103769188017


NDVI (min. NDVI composite)I


Roman et al. (2009) index


St

8.6432638506

Rcv

0.0139829595002

Rse

0.0

Rst

0.119276966261

Rsv

-0.213831179157


NDVI range @ 1km [-]

0.05

NDVI range @ 2km [-]

0.06

NDVI range @ 5km [-]

0.1

NDVI range @ 10km [-]

0.17

NDVI range @ 20km [-]

0.17


NDVI slope @ 1 km

0.000484753786724

NDVI slope @ 2 km

0.000543086336464

NDVI slope @ 5 km

0.000557028678502

NDVI slope @ 10 km

0.000342669825318

NDVI slope @ 20 km

0.000106300976609


Temporal stability analysis

+000 deg (BHR)


BHR statistics

Temporal stability [1/decade]:


abs

rel


Weighted least square:

-99999.0


Ordinary least square:

-99999.0


Probabilities that GCOS criteria is met:

Weighted least square:

-99999.0 %

Ordinary least square:

-99999.0 %


DHR statistics

Temporal stability [1/decade]:


abs

rel


Weighted least square:

-99999.0


Ordinary least square:

-99999.0


Probabilities that GCOS criteria is met:

Weighted least square:

-99999.0 %

Ordinary least square:

-99999.0 %


+057/+063 deg (BHR)


BHR statistics

Temporal stability [1/decade]:


abs

rel


Weighted least square:

-99999.0


Ordinary least square:

-99999.0


Probabilities that GCOS criteria is met:

Weighted least square:

-99999.0 %

Ordinary least square:

-99999.0 %


DHR statistics

Temporal stability [1/decade]:


abs

rel


Weighted least square:

-99999.0


Ordinary least square:

-99999.0


Probabilities that GCOS criteria is met:

Weighted least square:

-99999.0 %

Ordinary least square:

-99999.0 %


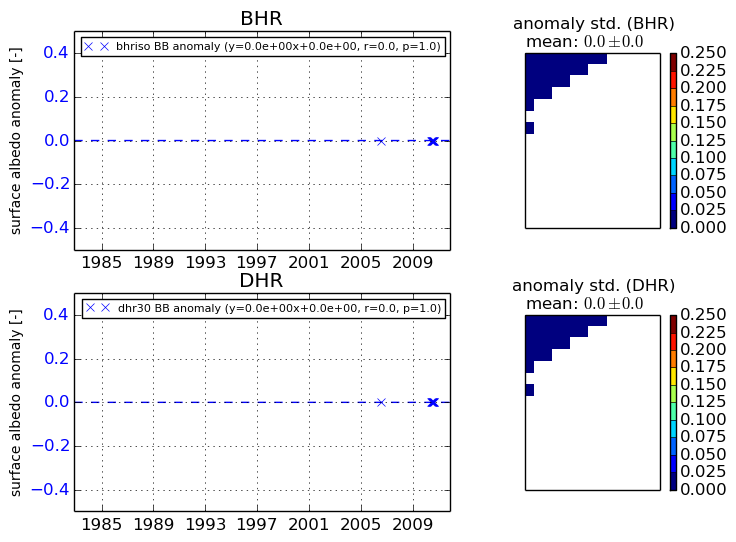
Temporal anomaly analyis

The variance of the temporal anomalies provides an additional measure about the stability of the signal AFTER removal of the mean seasonal cylce.

+000 deg


+057/+063 deg