SE-SK2


Location

lon / lat [deg]: 17.8401 / 60.1297

Source network: FLUXNET


Geostationary surface albedo (GSA) data


“+000”


“+057/+063”


Landcover information (based on ESA CCI landcover data)


Landcover fractions @ 2km distance


Landcover fractions @ 20 km distance


Legend


Distance to open water bodies [km]:

3.38

Distance to urban areas [km]:

7.09


Radius: 1 km

Number of landcover classes:

1

Dominant landcover type:

70: Tree cover, needleleaved, evergreen, closed to open (>15%)

Fraction of dominant landcover type [%]:

100.0


Radius: 2 km

Number of landcover classes:

3

Dominant landcover type:

70: Tree cover, needleleaved, evergreen, closed to open (>15%)

Fraction of dominant landcover type [%]:

96.0


Radius: 5 km

Number of landcover classes:

5

Dominant landcover type:

70: Tree cover, needleleaved, evergreen, closed to open (>15%)

Fraction of dominant landcover type [%]:

75.0


Radius: 10 km

Number of landcover classes:

6

Dominant landcover type:

70: Tree cover, needleleaved, evergreen, closed to open (>15%)

Fraction of dominant landcover type [%]:

78.0


Radius: 20 km

Number of landcover classes:

7

Dominant landcover type:

70: Tree cover, needleleaved, evergreen, closed to open (>15%)

Fraction of dominant landcover type [%]:

64.0


Disturbances


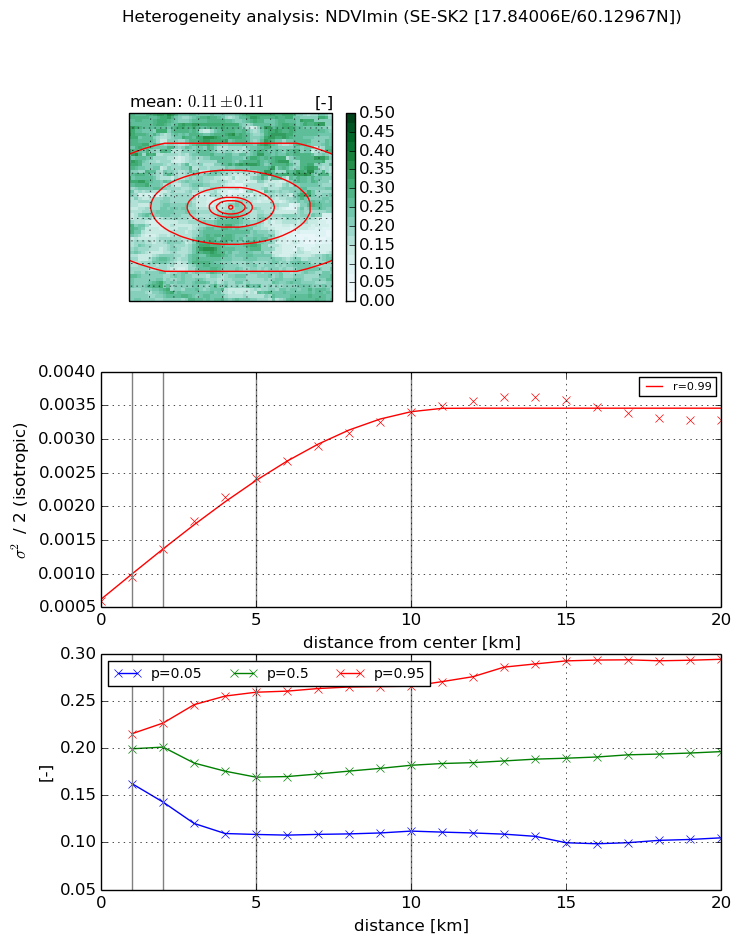
Heterogeneity analysis

The heterogeneity analysis provides information about the spatial and temporal heterogeneity of the site.

Topography


Roman et al. (2009) index


St

2.76393194792

Rcv

0.559847649328

Rse

0.0

Rst

0.0210208087798

Rsv

0.504541767804


Height range @ 1km [m]

7

Height range @ 2km [m]

13

Height range @ 5km [m]

46

Height range @ 10km [m]

-999

Height range @ 20km [m]

-999


Variance slope @ 1 km

54

Variance slope @ 2 km

55

Variance slope @ 5 km

53

Variance slope @ 10 km

-999

Variance slope @ 20 km

-999


NDVI (max. NDVI composite)


Roman et al. (2009) index


St

13.5818315467

Rcv

0.0527890455715

Rse

0.0

Rst

-0.0672232911283

Rsv

0.100870980081


NDVI range @ 1km [-]

0.01

NDVI range @ 2km [-]

0.03

NDVI range @ 5km [-]

0.07

NDVI range @ 10km [-]

0.07

NDVI range @ 20km [-]

0.08


Variance slope @ 1 km

7.46021032445e-05

Variance slope @ 2 km

8.4330006997e-05

Variance slope @ 5 km

8.34394325698e-05

Variance slope @ 10 km

5.75699677266e-05

Variance slope @ 20 km

2.73690484951e-05


NDVI (min. NDVI composite)I


Roman et al. (2009) index


St

2.92364467649

Rcv

0.185921866011

Rse

0.0

Rst

-0.0433054031358

Rsv

0.796889216255


NDVI range @ 1km [-]

0.05

NDVI range @ 2km [-]

0.08

NDVI range @ 5km [-]

0.15

NDVI range @ 10km [-]

0.15

NDVI range @ 20km [-]

0.19


NDVI slope @ 1 km

0.000362510836414

NDVI slope @ 2 km

0.000388182918863

NDVI slope @ 5 km

0.000373435456623

NDVI slope @ 10 km

0.00028361004464

NDVI slope @ 20 km

0.000124444179948


Temporal stability analysis

+000 deg (BHR)


BHR statistics

Temporal stability [1/decade]:


abs

rel


Weighted least square:

-99999.0


Ordinary least square:

-99999.0


Probabilities that GCOS criteria is met:

Weighted least square:

-99999.0 %

Ordinary least square:

-99999.0 %


DHR statistics

Temporal stability [1/decade]:


abs

rel


Weighted least square:

-99999.0


Ordinary least square:

-99999.0


Probabilities that GCOS criteria is met:

Weighted least square:

-99999.0 %

Ordinary least square:

-99999.0 %


+057/+063 deg (BHR)


BHR statistics

Temporal stability [1/decade]:


abs

rel


Weighted least square:

-99999.0


Ordinary least square:

-99999.0


Probabilities that GCOS criteria is met:

Weighted least square:

-99999.0 %

Ordinary least square:

-99999.0 %


DHR statistics

Temporal stability [1/decade]:


abs

rel


Weighted least square:

-99999.0


Ordinary least square:

-99999.0


Probabilities that GCOS criteria is met:

Weighted least square:

-99999.0 %

Ordinary least square:

-99999.0 %


Temporal anomaly analyis

The variance of the temporal anomalies provides an additional measure about the stability of the signal AFTER removal of the mean seasonal cylce.

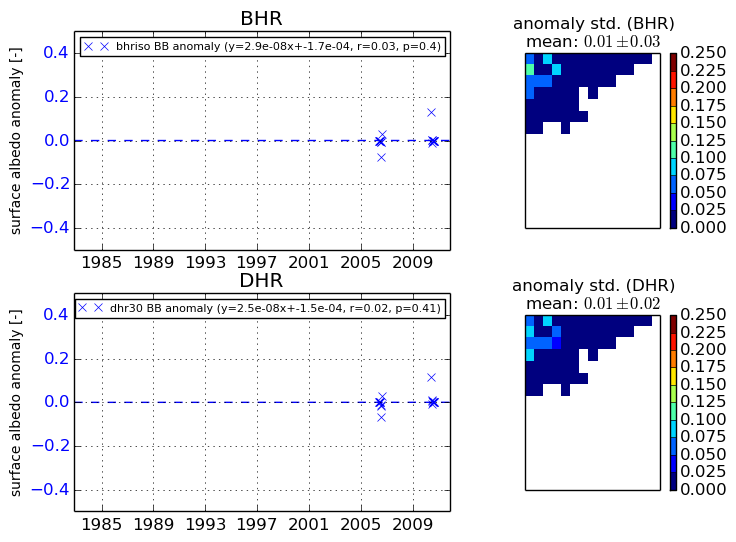
+000 deg


+057/+063 deg