SE-ST1


Location

lon / lat [deg]: 19.0497 / 68.3667

Source network: FLUXNET


Geostationary surface albedo (GSA) data


“+000”


“+057/+063”


Landcover information (based on ESA CCI landcover data)


Landcover fractions @ 2km distance


Landcover fractions @ 20 km distance


Legend


Distance to open water bodies [km]:

0.16

Distance to urban areas [km]:

33.3


Radius: 1 km

Number of landcover classes:

3

Dominant landcover type:

70: Tree cover, needleleaved, evergreen, closed to open (>15%)

Fraction of dominant landcover type [%]:

53.0


Radius: 2 km

Number of landcover classes:

4

Dominant landcover type:

70: Tree cover, needleleaved, evergreen, closed to open (>15%)

Fraction of dominant landcover type [%]:

48.0


Radius: 5 km

Number of landcover classes:

5

Dominant landcover type:

210: water bodies

Fraction of dominant landcover type [%]:

50.0


Radius: 10 km

Number of landcover classes:

6

Dominant landcover type:

210: water bodies

Fraction of dominant landcover type [%]:

33.0


Radius: 20 km

Number of landcover classes:

6

Dominant landcover type:

150: Sparse vegetation (tree, shrub, herbaceous cover) (<15%)

Fraction of dominant landcover type [%]:

35.0


Disturbances


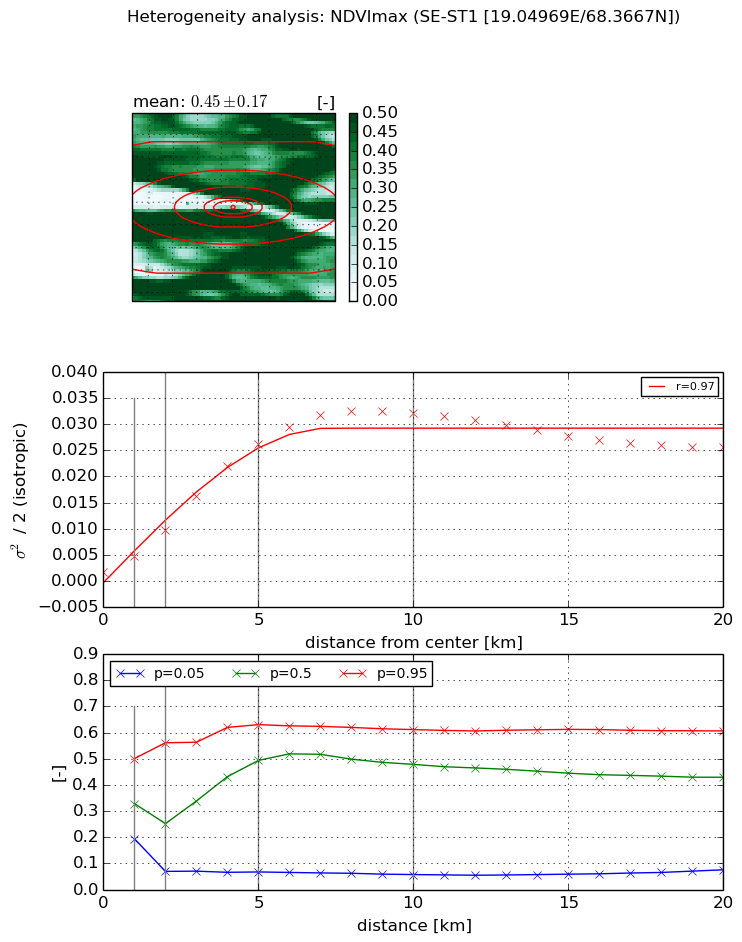
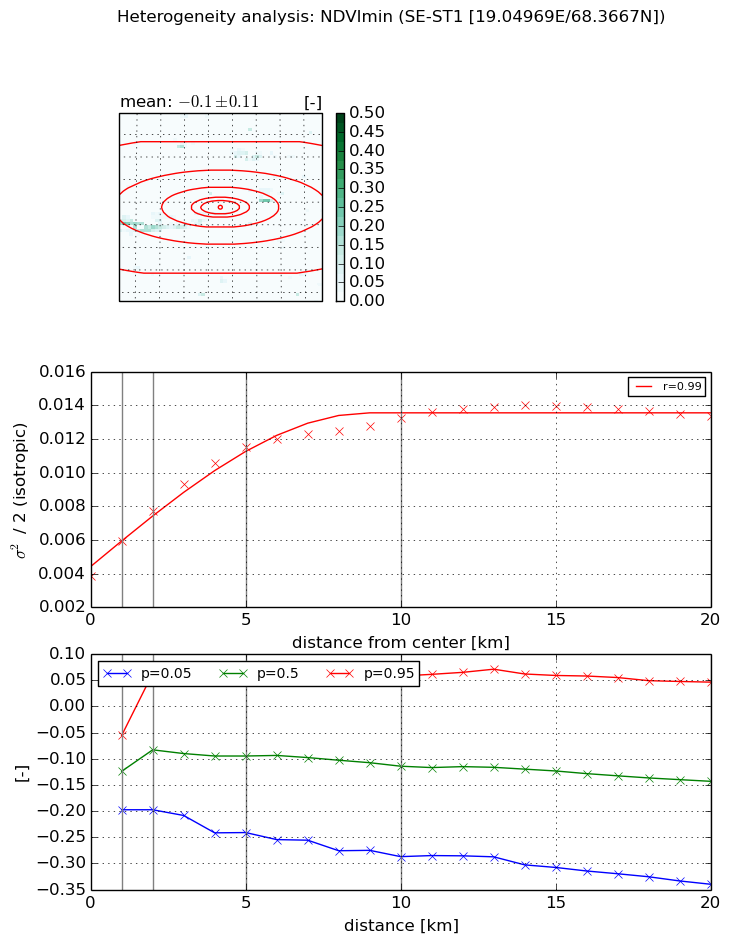
Heterogeneity analysis

The heterogeneity analysis provides information about the spatial and temporal heterogeneity of the site.

Topography


Roman et al. (2009) index


St

0.0512251447914

Rcv

2.01911618716

Rse

0.0

Rst

6.49807573381e-07

Rsv

56.5458713581


Height range @ 1km [m]

10

Height range @ 2km [m]

46

Height range @ 5km [m]

362

Height range @ 10km [m]

-999

Height range @ 20km [m]

-999


Variance slope @ 1 km

1551

Variance slope @ 2 km

2377

Variance slope @ 5 km

3296

Variance slope @ 10 km

-999

Variance slope @ 20 km

-999


NDVI (max. NDVI composite)


Roman et al. (2009) index


St

10.1748029351

Rcv

-0.117732214446

Rse

0.0

Rst

0.0482896842571

Rsv

-0.128824106583


NDVI range @ 1km [-]

0.31

NDVI range @ 2km [-]

0.49

NDVI range @ 5km [-]

0.56

NDVI range @ 10km [-]

0.55

NDVI range @ 20km [-]

0.53


Variance slope @ 1 km

0.0029656630403

Variance slope @ 2 km

0.00399948153339

Variance slope @ 5 km

0.00516412682785

Variance slope @ 10 km

0.00336297078851

Variance slope @ 20 km

0.000849780040796


NDVI (min. NDVI composite)I


Roman et al. (2009) index


St

8.5530423371

Rcv

-0.0597153848264

Rse

0.0

Rst

-0.144476106954

Rsv

-0.146560893367


NDVI range @ 1km [-]

0.14

NDVI range @ 2km [-]

0.26

NDVI range @ 5km [-]

0.3

NDVI range @ 10km [-]

0.35

NDVI range @ 20km [-]

0.39


NDVI slope @ 1 km

0.00203862156183

NDVI slope @ 2 km

0.00191464280305

NDVI slope @ 5 km

0.00153877607282

NDVI slope @ 10 km

0.000873472606273

NDVI slope @ 20 km

0.000378805320027


Temporal stability analysis

+000 deg (BHR)


BHR statistics

Temporal stability [1/decade]:


abs

rel


Weighted least square:

-99999.0


Ordinary least square:

-99999.0


Probabilities that GCOS criteria is met:

Weighted least square:

-99999.0 %

Ordinary least square:

-99999.0 %


DHR statistics

Temporal stability [1/decade]:


abs

rel


Weighted least square:

-99999.0


Ordinary least square:

-99999.0


Probabilities that GCOS criteria is met:

Weighted least square:

-99999.0 %

Ordinary least square:

-99999.0 %


+057/+063 deg (BHR)


BHR statistics

Temporal stability [1/decade]:


abs

rel


Weighted least square:

-99999.0


Ordinary least square:

-99999.0


Probabilities that GCOS criteria is met:

Weighted least square:

-99999.0 %

Ordinary least square:

-99999.0 %


DHR statistics

Temporal stability [1/decade]:


abs

rel


Weighted least square:

-99999.0


Ordinary least square:

-99999.0


Probabilities that GCOS criteria is met:

Weighted least square:

-99999.0 %

Ordinary least square:

-99999.0 %


Temporal anomaly analyis

The variance of the temporal anomalies provides an additional measure about the stability of the signal AFTER removal of the mean seasonal cylce.

+000 deg


+057/+063 deg