SEGC_LOPE_GABON


Location

lon / lat [deg]: 11.6008 / -0.2016

Source network: AERONET


Geostationary surface albedo (GSA) data


“+000”


“+057/+063”


Landcover information (based on ESA CCI landcover data)


Landcover fractions @ 2km distance


Landcover fractions @ 20 km distance


Legend


Distance to open water bodies [km]:

10.09

Distance to urban areas [km]:

9.34


Radius: 1 km

Number of landcover classes:

5

Dominant landcover type:

30: mosaic cropland (>50%), natural veg. (< 50%)

Fraction of dominant landcover type [%]:

44.0


Radius: 2 km

Number of landcover classes:

5

Dominant landcover type:

30: mosaic cropland (>50%), natural veg. (< 50%)

Fraction of dominant landcover type [%]:

40.0


Radius: 5 km

Number of landcover classes:

5

Dominant landcover type:

50: Tree cover, broadleaved, evergreen, closed to open (>15%)

Fraction of dominant landcover type [%]:

41.0


Radius: 10 km

Number of landcover classes:

5

Dominant landcover type:

50: Tree cover, broadleaved, evergreen, closed to open (>15%)

Fraction of dominant landcover type [%]:

55.0


Radius: 20 km

Number of landcover classes:

8

Dominant landcover type:

50: Tree cover, broadleaved, evergreen, closed to open (>15%)

Fraction of dominant landcover type [%]:

56.0


Disturbances


Heterogeneity analysis

The heterogeneity analysis provides information about the spatial and temporal heterogeneity of the site.

Topography


Roman et al. (2009) index


St

6.42667297327e-05

Rcv

0.590776851956

Rse

0.0

Rst

3.61390257026e-05

Rsv

46679.861304


Height range @ 1km [m]

41

Height range @ 2km [m]

82

Height range @ 5km [m]

188

Height range @ 10km [m]

-999

Height range @ 20km [m]

-999


Variance slope @ 1 km

142

Variance slope @ 2 km

286

Variance slope @ 5 km

715

Variance slope @ 10 km

-999

Variance slope @ 20 km

-999


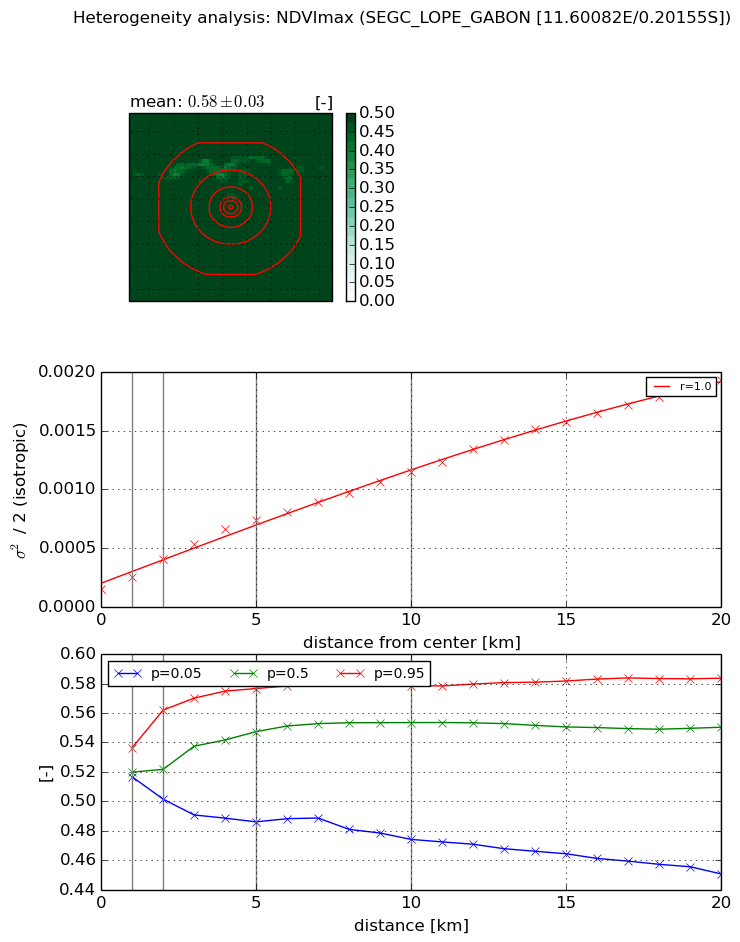
NDVI (max. NDVI composite)


Roman et al. (2009) index


St

1.83218024346

Rcv

0.251234791857

Rse

0.0

Rst

-0.230315630398

Rsv

1.15584306603


NDVI range @ 1km [-]

0.02

NDVI range @ 2km [-]

0.06

NDVI range @ 5km [-]

0.09

NDVI range @ 10km [-]

0.1

NDVI range @ 20km [-]

0.13


Variance slope @ 1 km

9.8311534074e-05

Variance slope @ 2 km

0.0001275718642

Variance slope @ 5 km

0.000121093003859

Variance slope @ 10 km

9.74528597572e-05

Variance slope @ 20 km

8.69388540513e-05


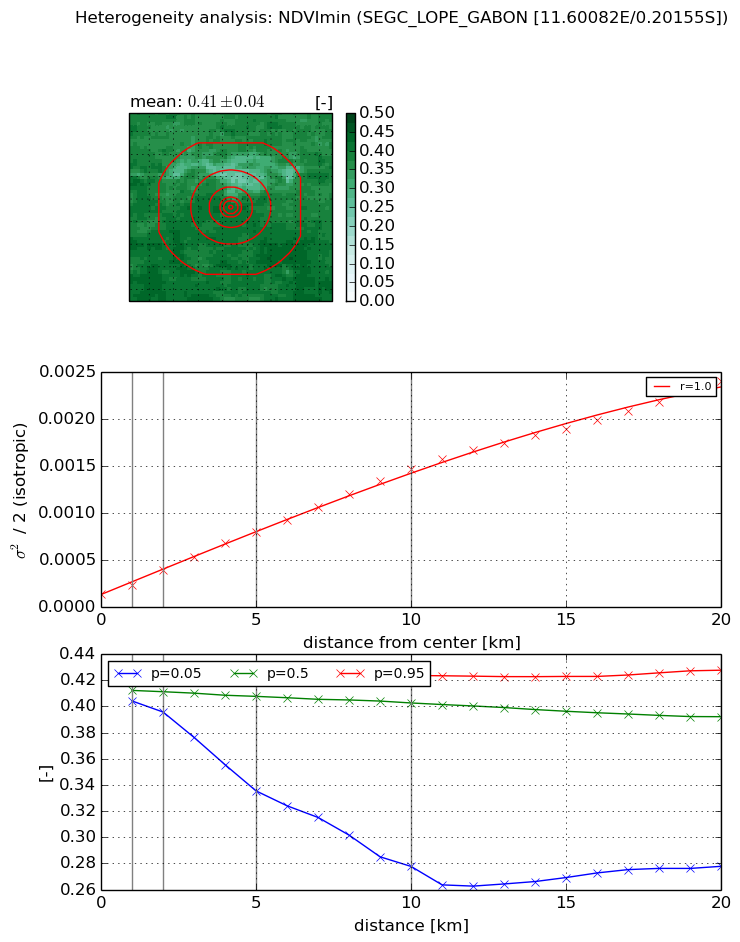
NDVI (min. NDVI composite)I


Roman et al. (2009) index


St

0.890412494608

Rcv

0.726556609619

Rse

0.0

Rst

-0.552106298389

Rsv

2.09056205027


NDVI range @ 1km [-]

0.02

NDVI range @ 2km [-]

0.03

NDVI range @ 5km [-]

0.09

NDVI range @ 10km [-]

0.15

NDVI range @ 20km [-]

0.15


NDVI slope @ 1 km

9.36720965657e-05

NDVI slope @ 2 km

0.000125559240308

NDVI slope @ 5 km

0.000137078463524

NDVI slope @ 10 km

0.000134958675806

NDVI slope @ 20 km

0.000112386569586


Temporal stability analysis

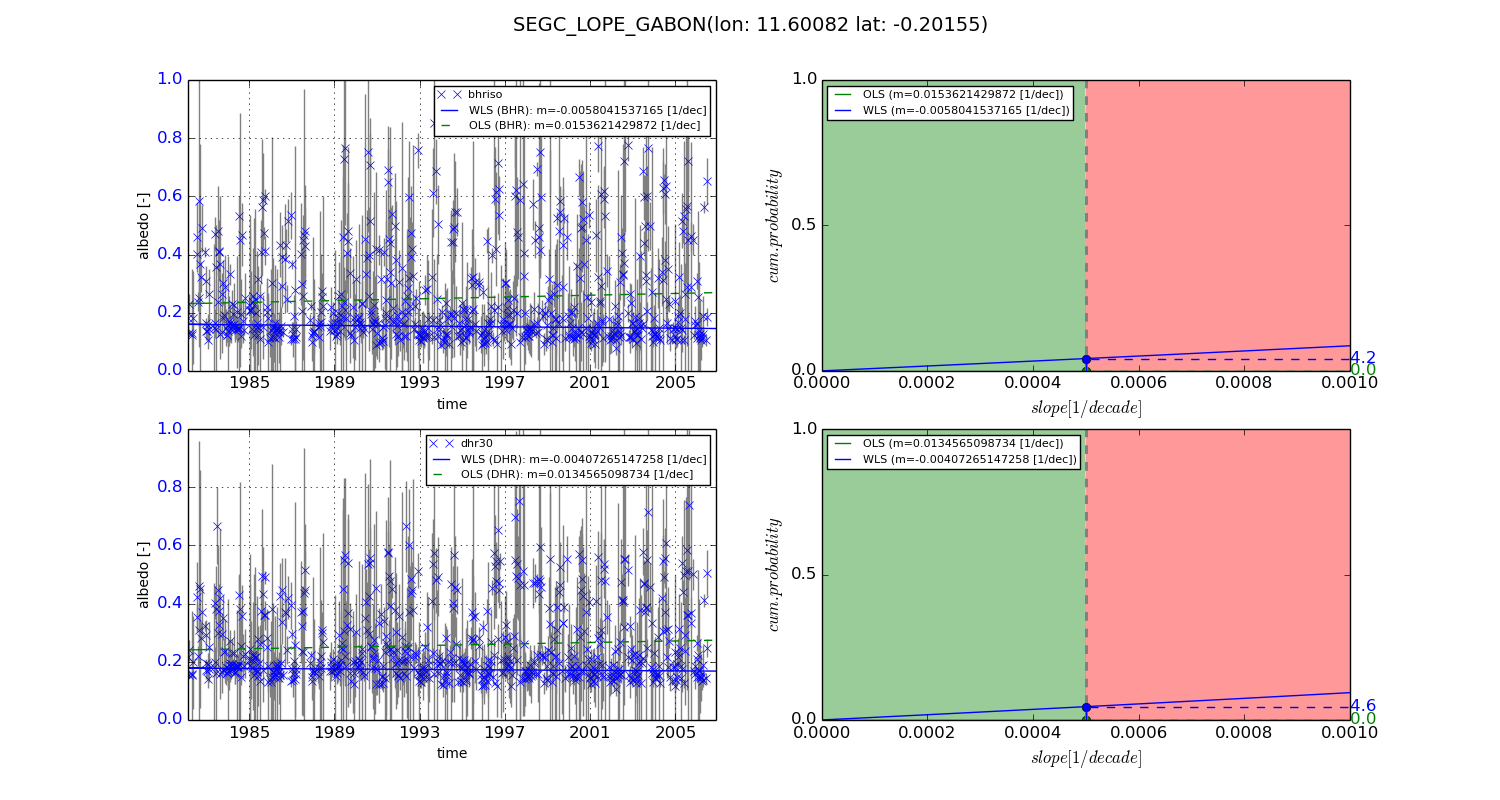
+000 deg (BHR)


BHR statistics

Temporal stability [1/decade]:


abs

rel


Weighted least square:

-0.0058041537165


Ordinary least square:

0.0153621429872


Probabilities that GCOS criteria is met:

Weighted least square:

4.2 %

Ordinary least square:

0.0 %


DHR statistics

Temporal stability [1/decade]:


abs

rel


Weighted least square:

-0.00407265147258


Ordinary least square:

0.0134565098734


Probabilities that GCOS criteria is met:

Weighted least square:

4.6 %

Ordinary least square:

0.0 %


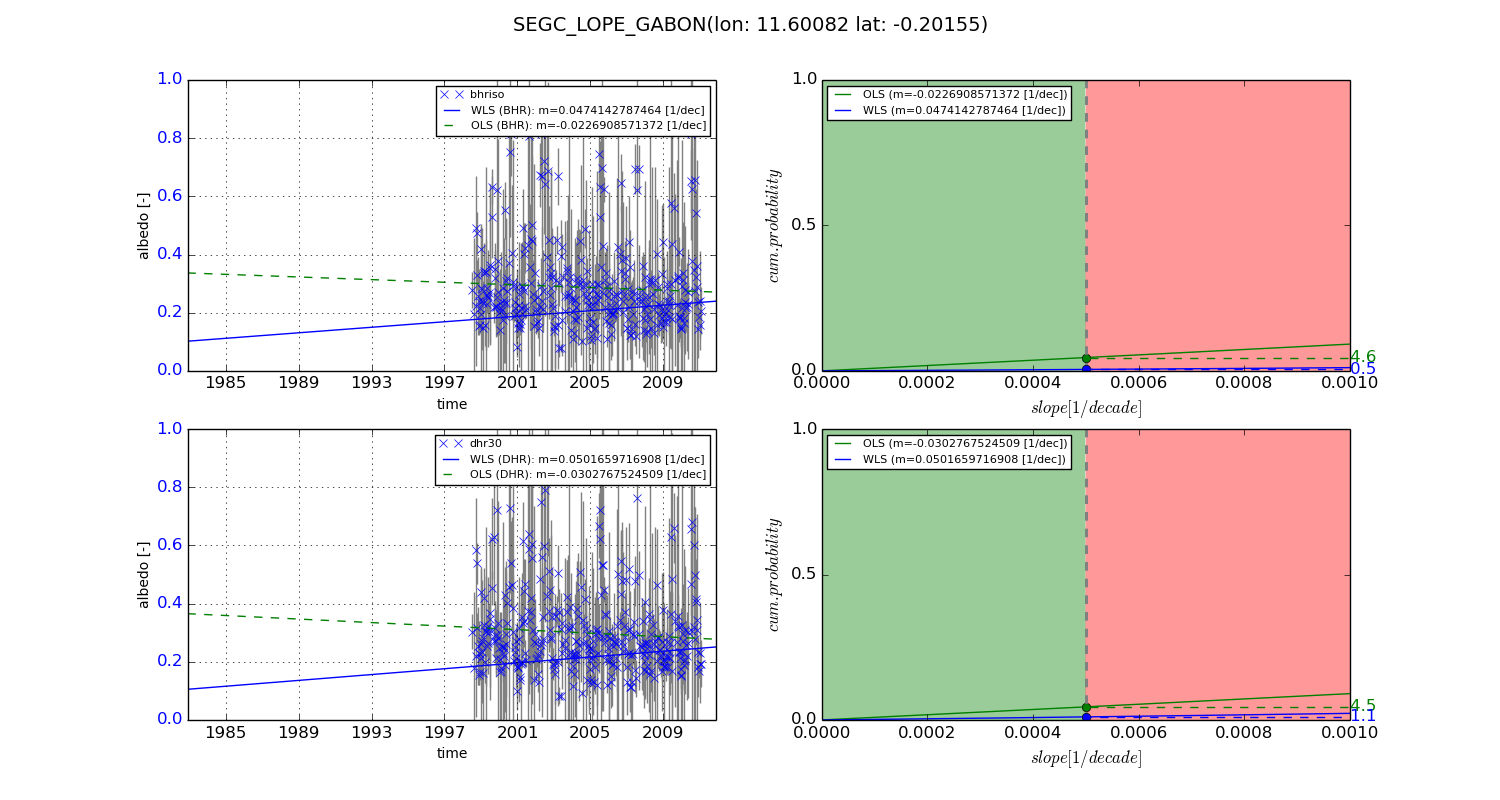
+057/+063 deg (BHR)


BHR statistics

Temporal stability [1/decade]:


abs

rel


Weighted least square:

0.0474142787464


Ordinary least square:

-0.0226908571372


Probabilities that GCOS criteria is met:

Weighted least square:

0.5 %

Ordinary least square:

4.6 %


DHR statistics

Temporal stability [1/decade]:


abs

rel


Weighted least square:

0.0501659716908


Ordinary least square:

-0.0302767524509


Probabilities that GCOS criteria is met:

Weighted least square:

1.1 %

Ordinary least square:

4.5 %


Temporal anomaly analyis

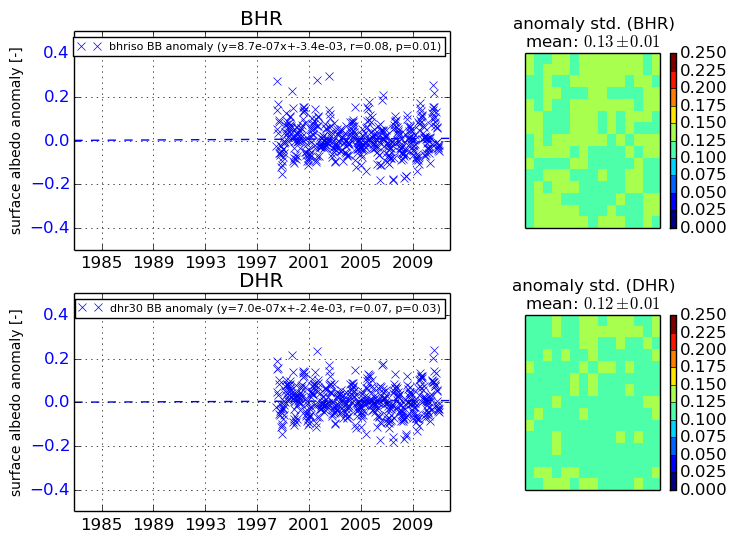
The variance of the temporal anomalies provides an additional measure about the stability of the signal AFTER removal of the mean seasonal cylce.
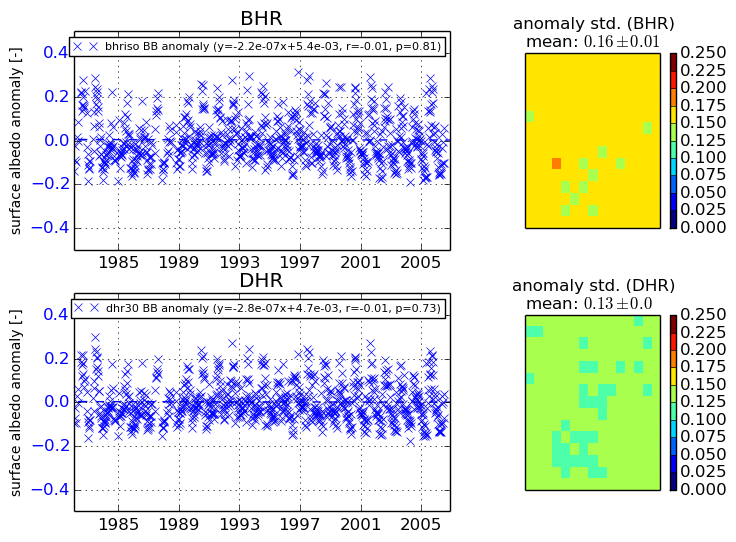
+000 deg


+057/+063 deg


By continuing to use this website, you are giving consent to analytic cookies being used. For more information on how EUMETSAT uses data and how you can disable this, please view this web page: Analytics Cookie Policy