SELIM


Location

lon / lat [deg]: 42.83 / 40.45

Source network: ALBEDOVAL2


Geostationary surface albedo (GSA) data


“+000”


“+057/+063”


Landcover information (based on ESA CCI landcover data)


Landcover fractions @ 2km distance


Landcover fractions @ 20 km distance


Legend


Distance to open water bodies [km]:

23.7

Distance to urban areas [km]:

1.76


Radius: 1 km

Number of landcover classes:

6

Dominant landcover type:

20: cropland, irrigated or post-flooded

Fraction of dominant landcover type [%]:

52.0


Radius: 2 km

Number of landcover classes:

7

Dominant landcover type:

20: cropland, irrigated or post-flooded

Fraction of dominant landcover type [%]:

48.0


Radius: 5 km

Number of landcover classes:

8

Dominant landcover type:

20: cropland, irrigated or post-flooded

Fraction of dominant landcover type [%]:

64.0


Radius: 10 km

Number of landcover classes:

8

Dominant landcover type:

20: cropland, irrigated or post-flooded

Fraction of dominant landcover type [%]:

68.0


Radius: 20 km

Number of landcover classes:

8

Dominant landcover type:

20: cropland, irrigated or post-flooded

Fraction of dominant landcover type [%]:

59.0


Disturbances


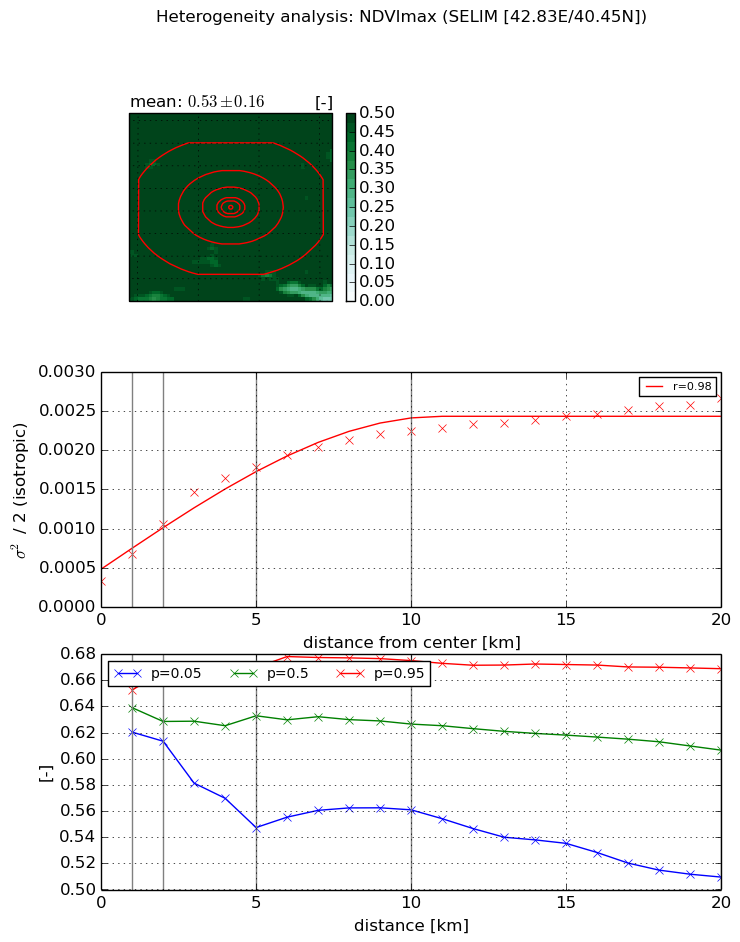
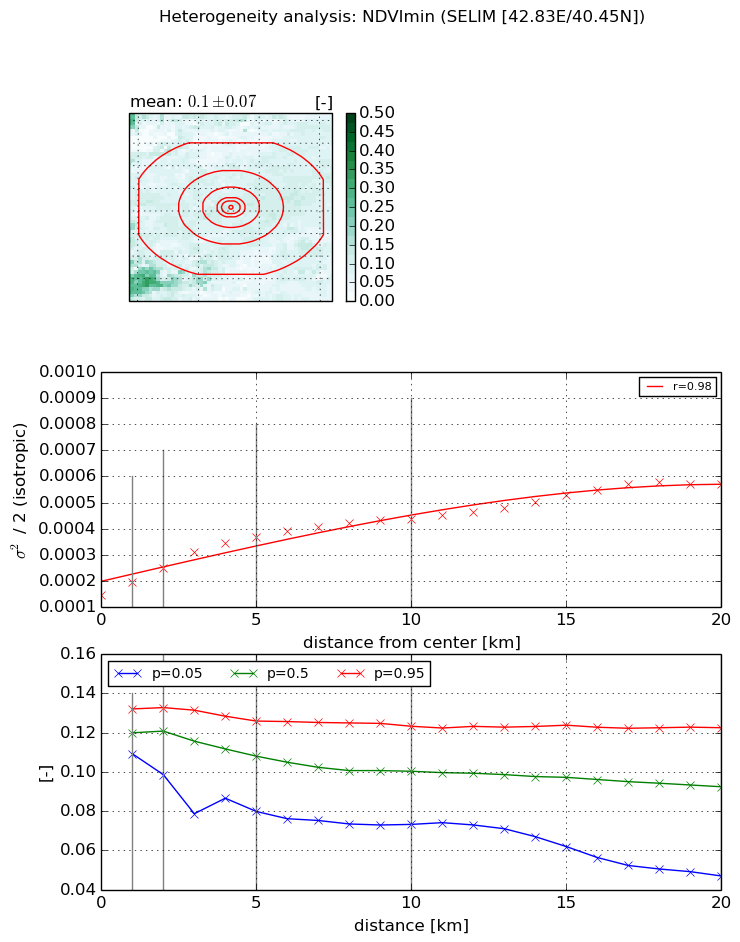
Heterogeneity analysis

The heterogeneity analysis provides information about the spatial and temporal heterogeneity of the site.

Topography


Roman et al. (2009) index


St

1.88063869576

Rcv

0.465097289998

Rse

0.0

Rst

-0.130524626145

Rsv

-0.999580823627


Height range @ 1km [m]

19

Height range @ 2km [m]

32

Height range @ 5km [m]

68

Height range @ 10km [m]

-999

Height range @ 20km [m]

-999


Variance slope @ 1 km

72

Variance slope @ 2 km

97

Variance slope @ 5 km

145

Variance slope @ 10 km

-999

Variance slope @ 20 km

-999


NDVI (max. NDVI composite)


Roman et al. (2009) index


St

1.58792934351

Rcv

0.293368577618

Rse

0.0

Rst

-0.146224610782

Rsv

1.44965963778


NDVI range @ 1km [-]

0.03

NDVI range @ 2km [-]

0.05

NDVI range @ 5km [-]

0.12

NDVI range @ 10km [-]

0.11

NDVI range @ 20km [-]

0.16


Variance slope @ 1 km

0.000352021734314

Variance slope @ 2 km

0.000366646554227

Variance slope @ 5 km

0.000302719820172

Variance slope @ 10 km

0.000184989879605

Variance slope @ 20 km

9.24199402072e-05


NDVI (min. NDVI composite)I


Roman et al. (2009) index


St

24.8550667771

Rcv

-0.0751714585539

Rse

0.0

Rst

-0.0370111662311

Rsv

0.00851711128521


NDVI range @ 1km [-]

0.02

NDVI range @ 2km [-]

0.03

NDVI range @ 5km [-]

0.05

NDVI range @ 10km [-]

0.05

NDVI range @ 20km [-]

0.08


NDVI slope @ 1 km

5.06425667665e-05

NDVI slope @ 2 km

5.23111591983e-05

NDVI slope @ 5 km

4.64906358417e-05

NDVI slope @ 10 km

2.88623743765e-05

NDVI slope @ 20 km

1.93316189361e-05


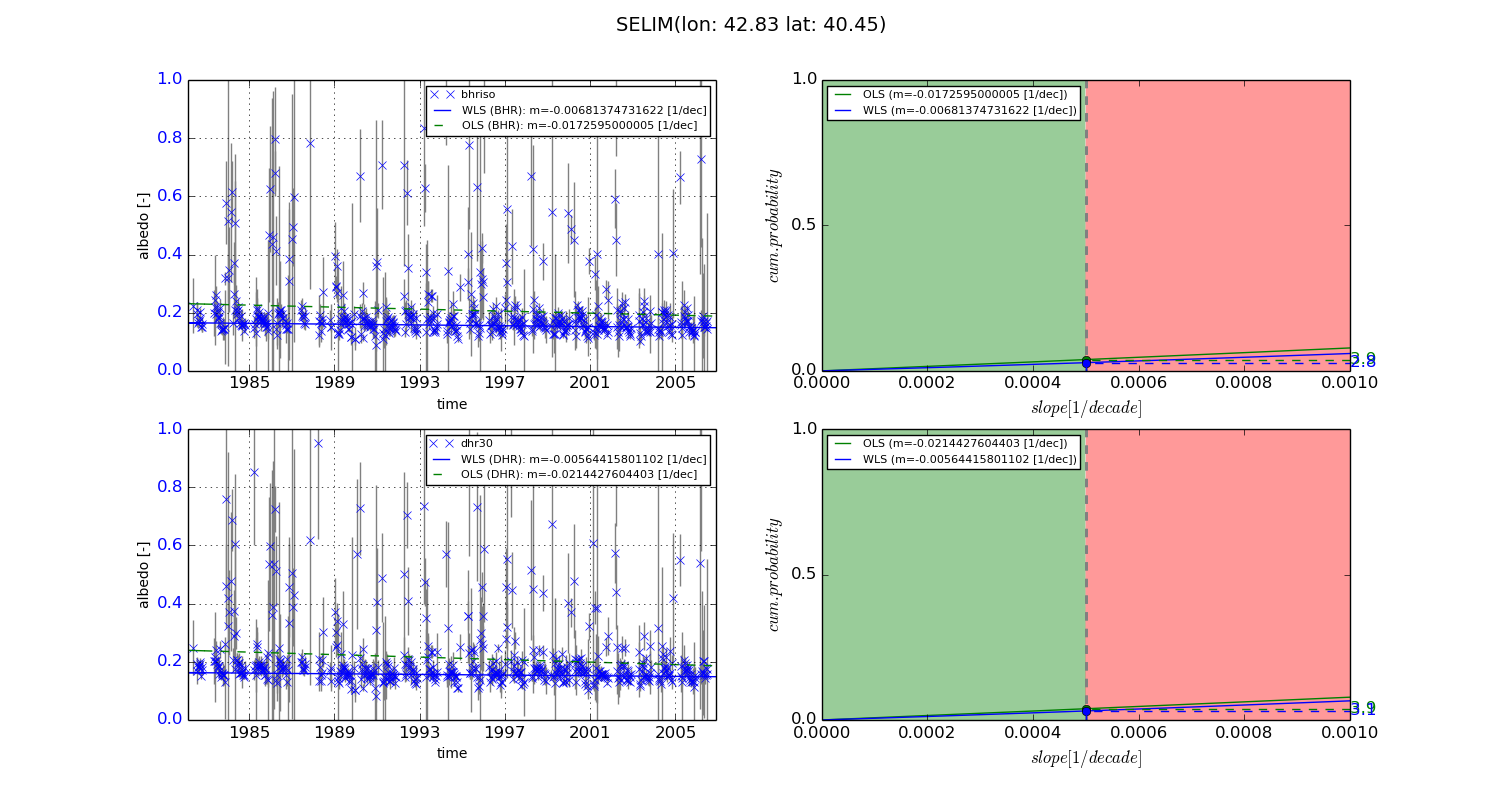
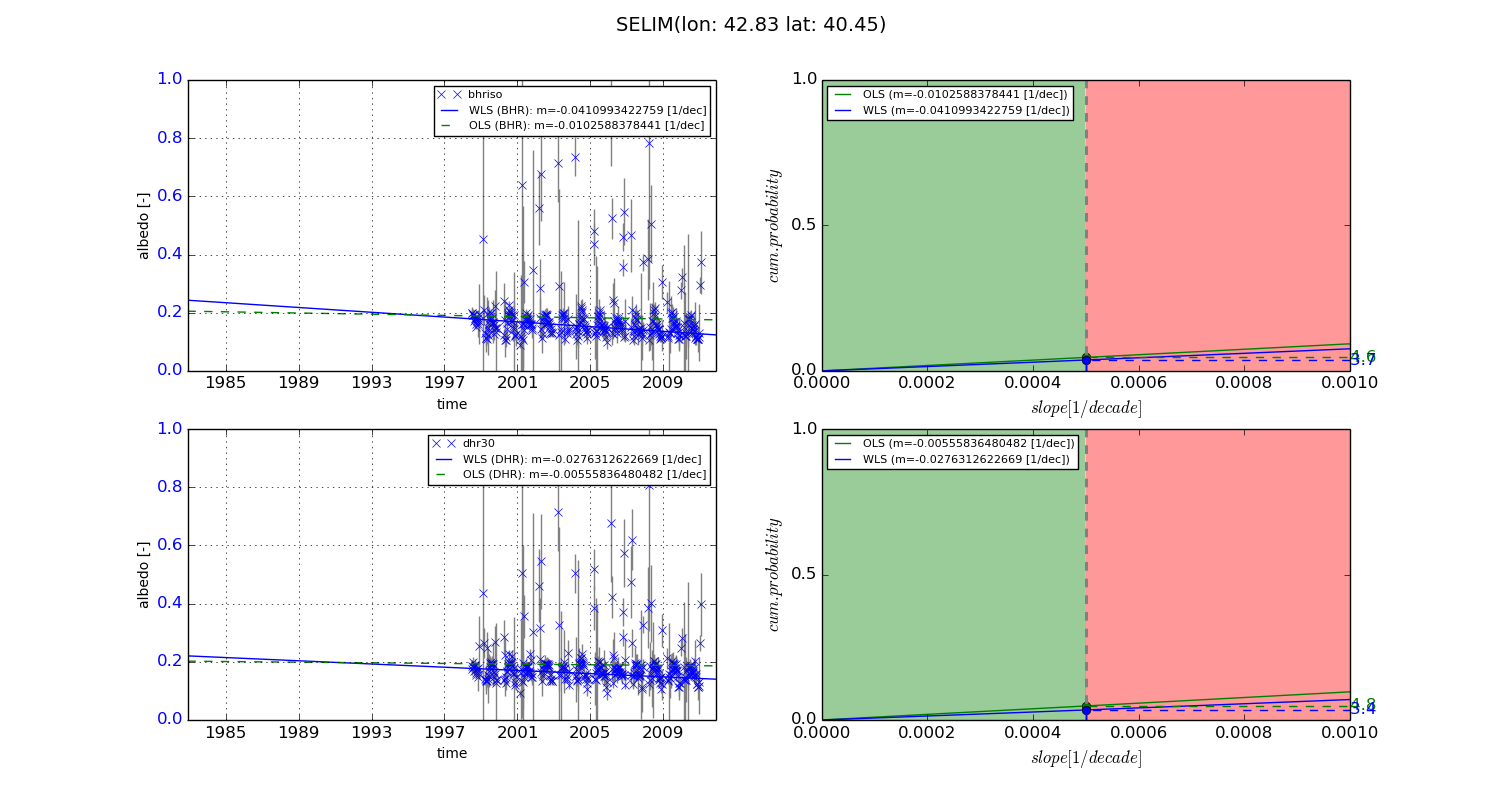
Temporal stability analysis

+000 deg (BHR)


BHR statistics

Temporal stability [1/decade]:


abs

rel


Weighted least square:

-0.00681374731622


Ordinary least square:

-0.0172595000005


Probabilities that GCOS criteria is met:

Weighted least square:

2.8 %

Ordinary least square:

3.9 %


DHR statistics

Temporal stability [1/decade]:


abs

rel


Weighted least square:

-0.00564415801102


Ordinary least square:

-0.0214427604403


Probabilities that GCOS criteria is met:

Weighted least square:

3.1 %

Ordinary least square:

3.9 %


+057/+063 deg (BHR)


BHR statistics

Temporal stability [1/decade]:


abs

rel


Weighted least square:

-0.0410993422759


Ordinary least square:

-0.0102588378441


Probabilities that GCOS criteria is met:

Weighted least square:

3.7 %

Ordinary least square:

4.6 %


DHR statistics

Temporal stability [1/decade]:


abs

rel


Weighted least square:

-0.0276312622669


Ordinary least square:

-0.00555836480482


Probabilities that GCOS criteria is met:

Weighted least square:

3.4 %

Ordinary least square:

4.8 %


Temporal anomaly analyis

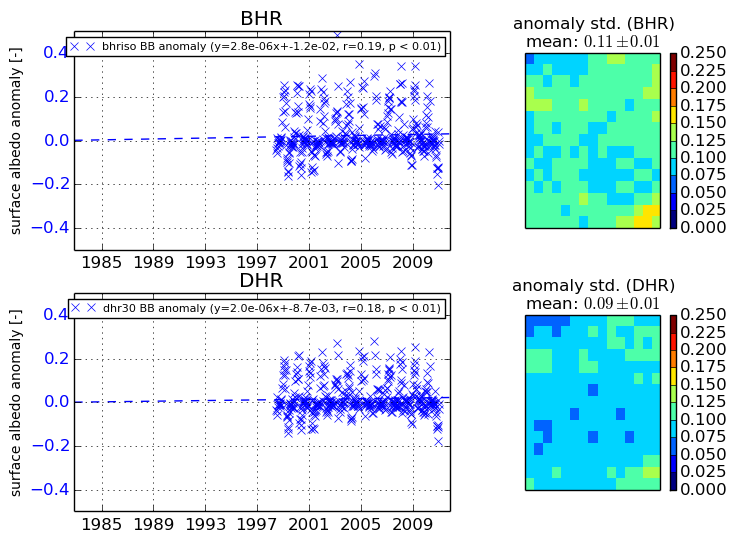
The variance of the temporal anomalies provides an additional measure about the stability of the signal AFTER removal of the mean seasonal cylce.
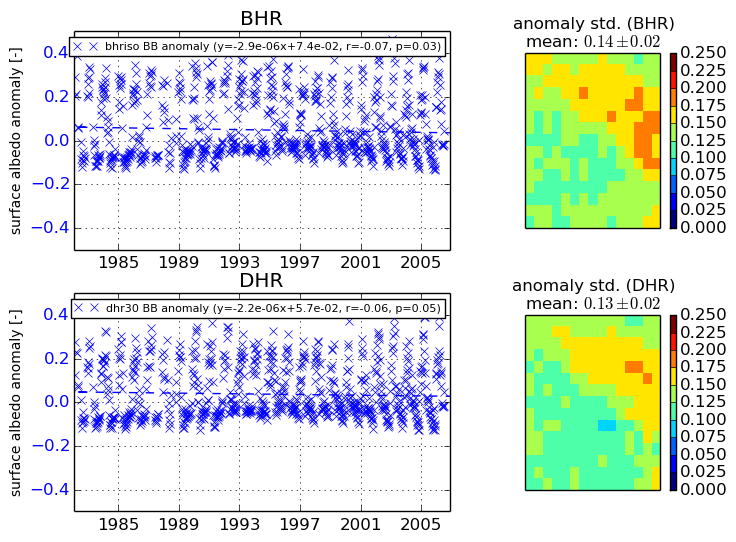
+000 deg


+057/+063 deg