SENANGA


Location

lon / lat [deg]: 23.2933 / -16.1089

Source network: AERONET


Geostationary surface albedo (GSA) data


“+000”


“+057/+063”


Landcover information (based on ESA CCI landcover data)


Landcover fractions @ 2km distance


Landcover fractions @ 20 km distance


Legend


Distance to open water bodies [km]:

0.39

Distance to urban areas [km]:

32.88


Radius: 1 km

Number of landcover classes:

3

Dominant landcover type:

20: cropland, irrigated or post-flooded

Fraction of dominant landcover type [%]:

52.0


Radius: 2 km

Number of landcover classes:

6

Dominant landcover type:

180: shrub or herbaceous cover, flooded, fresh/saline/brakish water

Fraction of dominant landcover type [%]:

37.0


Radius: 5 km

Number of landcover classes:

6

Dominant landcover type:

180: shrub or herbaceous cover, flooded, fresh/saline/brakish water

Fraction of dominant landcover type [%]:

35.0


Radius: 10 km

Number of landcover classes:

7

Dominant landcover type:

180: shrub or herbaceous cover, flooded, fresh/saline/brakish water

Fraction of dominant landcover type [%]:

40.0


Radius: 20 km

Number of landcover classes:

7

Dominant landcover type:

120: Shrubland

Fraction of dominant landcover type [%]:

33.0


Disturbances


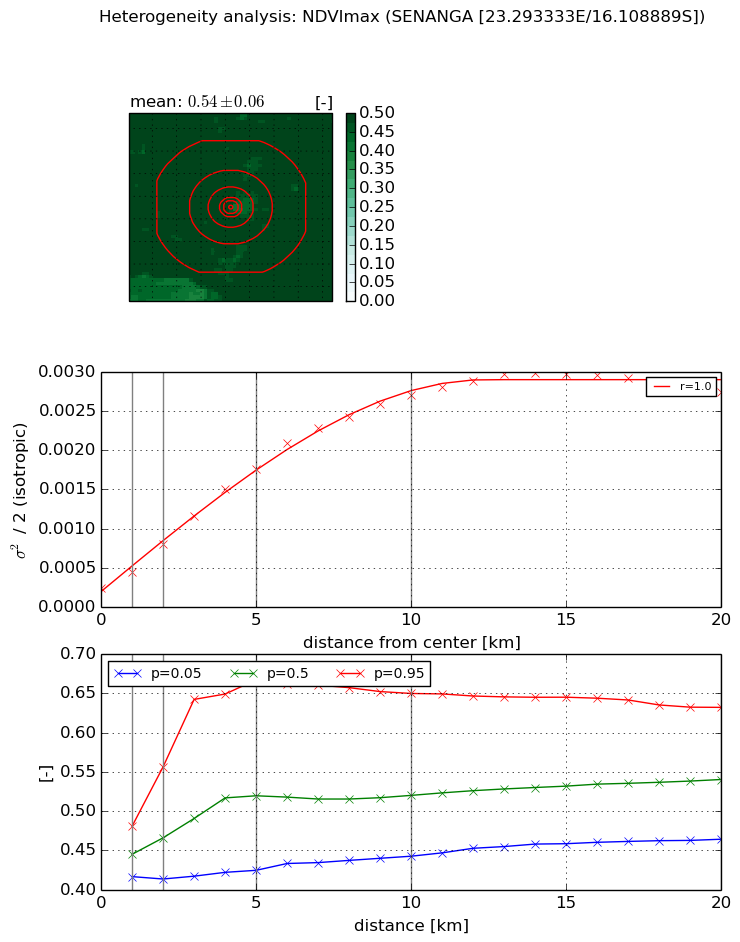
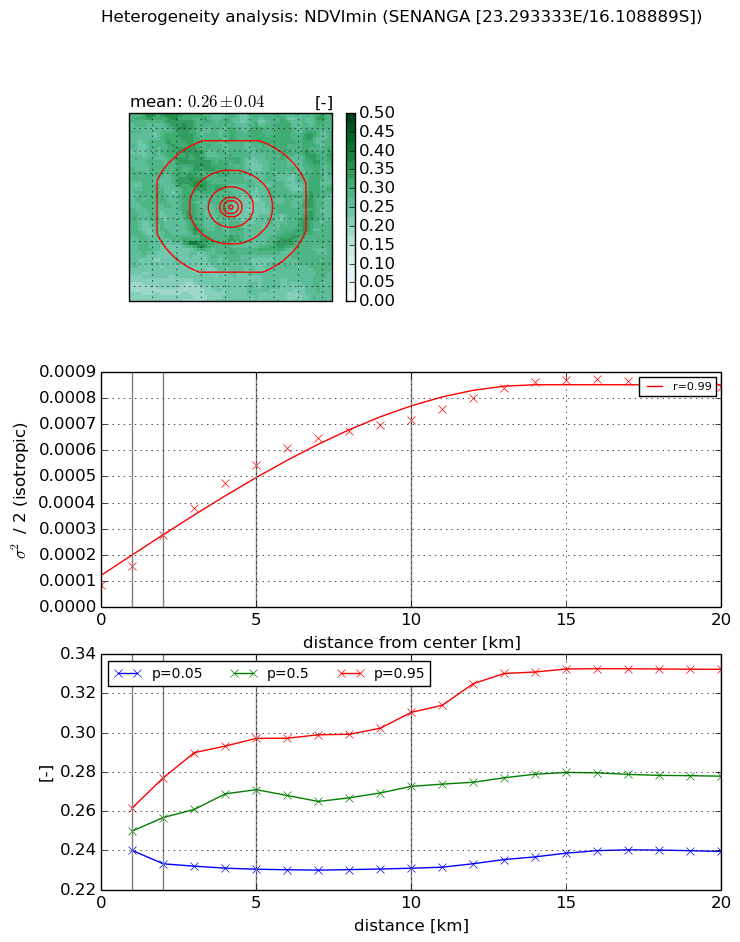
Heterogeneity analysis

The heterogeneity analysis provides information about the spatial and temporal heterogeneity of the site.

Topography


Roman et al. (2009) index


St

2.43685949937

Rcv

0.141858155077

Rse

0.0

Rst

-0.0892345692961

Rsv

-1.0


Height range @ 1km [m]

20

Height range @ 2km [m]

28

Height range @ 5km [m]

36

Height range @ 10km [m]

-999

Height range @ 20km [m]

-999


Variance slope @ 1 km

34

Variance slope @ 2 km

31

Variance slope @ 5 km

38

Variance slope @ 10 km

-999

Variance slope @ 20 km

-999


NDVI (max. NDVI composite)


Roman et al. (2009) index


St

1.64485338642e-07

Rcv

-0.00871190073993

Rse

0.0

Rst

0.288613648134

Rsv

18238707.3272


NDVI range @ 1km [-]

0.06

NDVI range @ 2km [-]

0.14

NDVI range @ 5km [-]

0.24

NDVI range @ 10km [-]

0.21

NDVI range @ 20km [-]

0.17


Variance slope @ 1 km

0.000208118081346

Variance slope @ 2 km

0.000276835186588

Variance slope @ 5 km

0.000317774753809

Variance slope @ 10 km

0.000259458374993

Variance slope @ 20 km

0.000125913982157


NDVI (min. NDVI composite)I


Roman et al. (2009) index


St

8.96746807676e-12

Rcv

0.0737406562814

Rse

0.0

Rst

0.289614807142

Rsv

3.3454259043e+11


NDVI range @ 1km [-]

0.02

NDVI range @ 2km [-]

0.04

NDVI range @ 5km [-]

0.07

NDVI range @ 10km [-]

0.08

NDVI range @ 20km [-]

0.09


NDVI slope @ 1 km

7.29114597965e-05

NDVI slope @ 2 km

9.52818330602e-05

NDVI slope @ 5 km

9.57626578511e-05

NDVI slope @ 10 km

6.53321341112e-05

NDVI slope @ 20 km

3.61336439353e-05


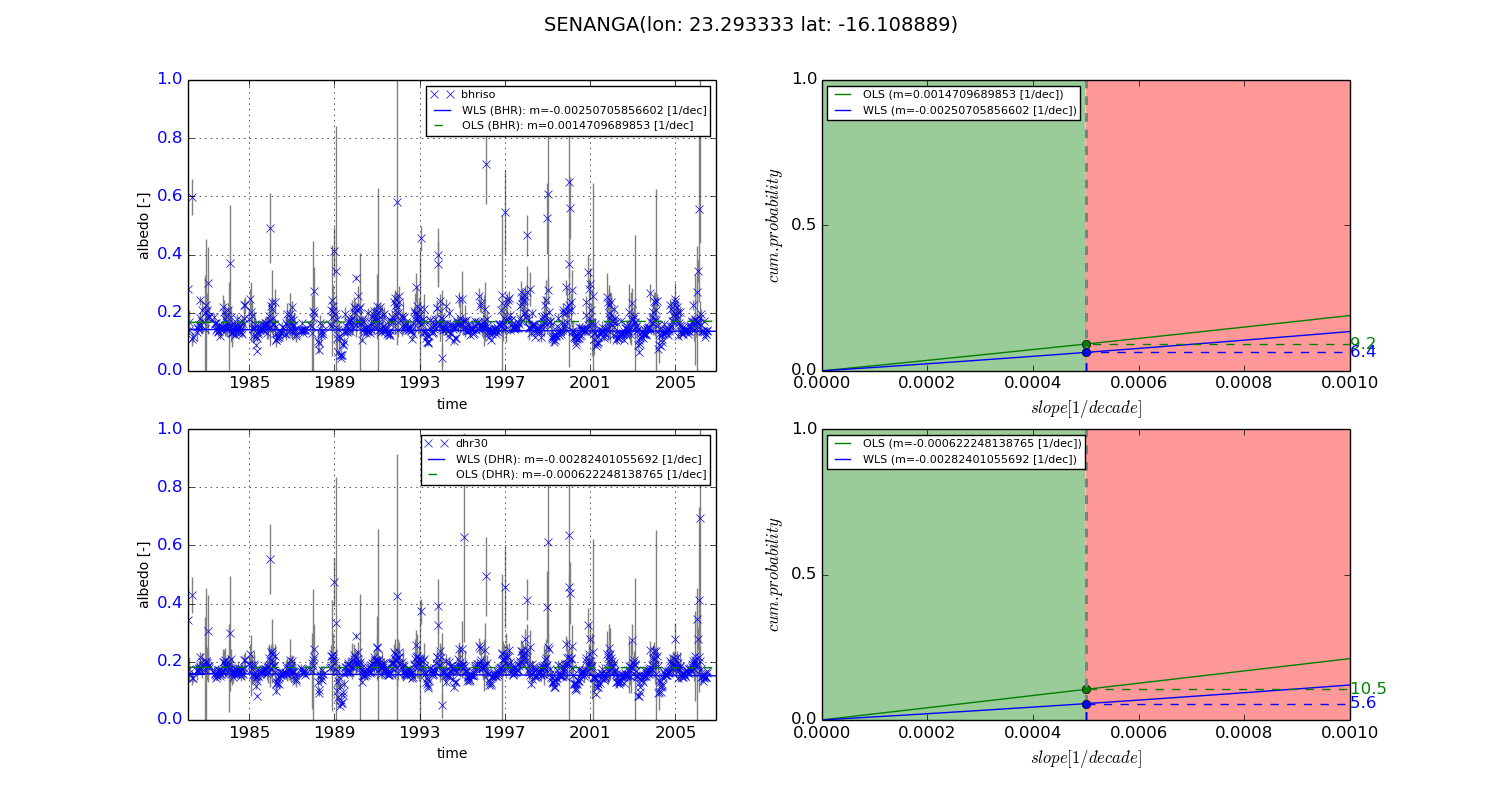
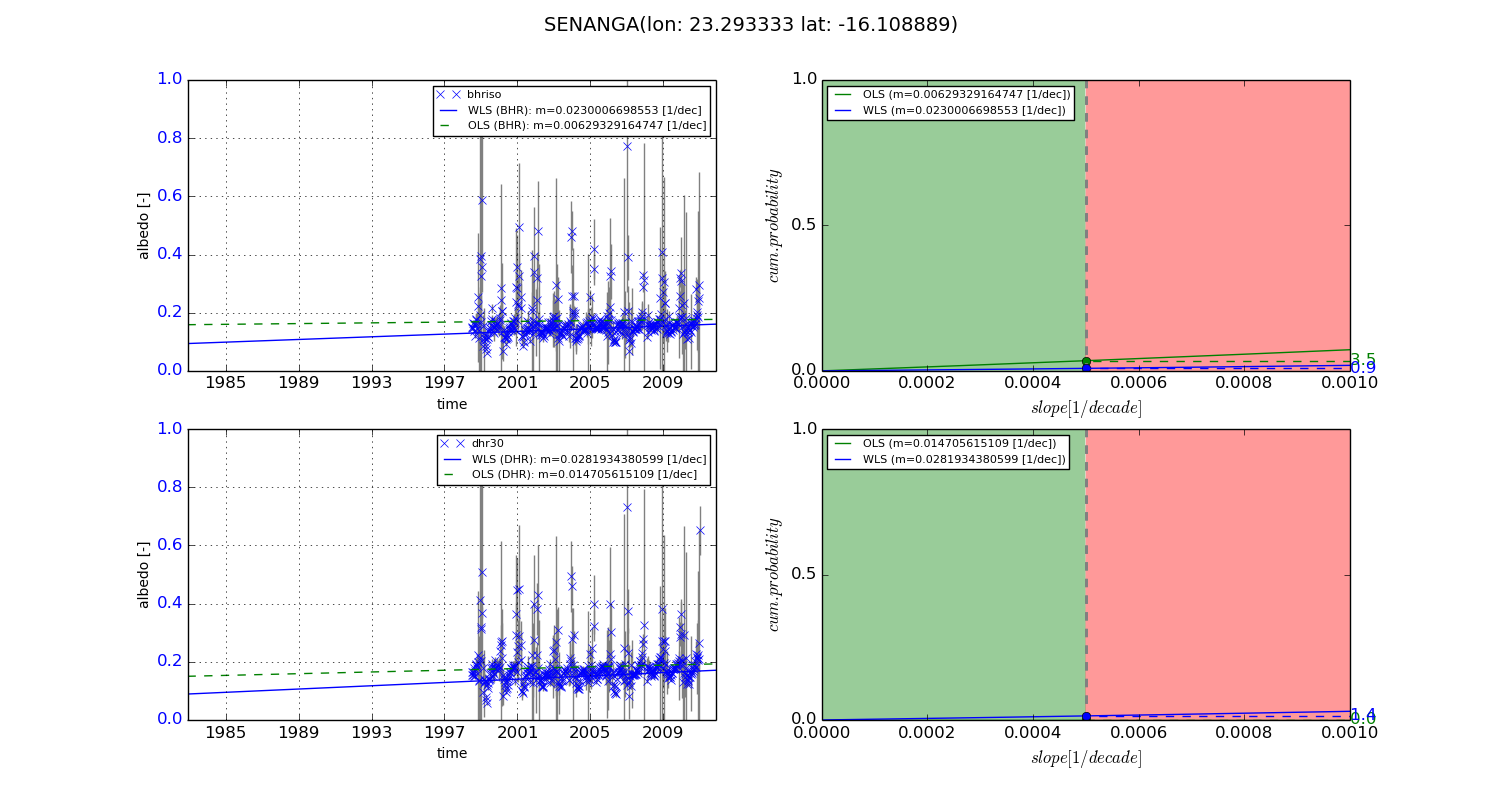
Temporal stability analysis

+000 deg (BHR)


BHR statistics

Temporal stability [1/decade]:


abs

rel


Weighted least square:

-0.00250705856602


Ordinary least square:

0.0014709689853


Probabilities that GCOS criteria is met:

Weighted least square:

6.4 %

Ordinary least square:

9.2 %


DHR statistics

Temporal stability [1/decade]:


abs

rel


Weighted least square:

-0.00282401055692


Ordinary least square:

-0.000622248138765


Probabilities that GCOS criteria is met:

Weighted least square:

5.6 %

Ordinary least square:

10.5 %


+057/+063 deg (BHR)


BHR statistics

Temporal stability [1/decade]:


abs

rel


Weighted least square:

0.0230006698553


Ordinary least square:

0.00629329164747


Probabilities that GCOS criteria is met:

Weighted least square:

0.9 %

Ordinary least square:

3.5 %


DHR statistics

Temporal stability [1/decade]:


abs

rel


Weighted least square:

0.0281934380599


Ordinary least square:

0.014705615109


Probabilities that GCOS criteria is met:

Weighted least square:

1.4 %

Ordinary least square:

0.0 %


Temporal anomaly analyis

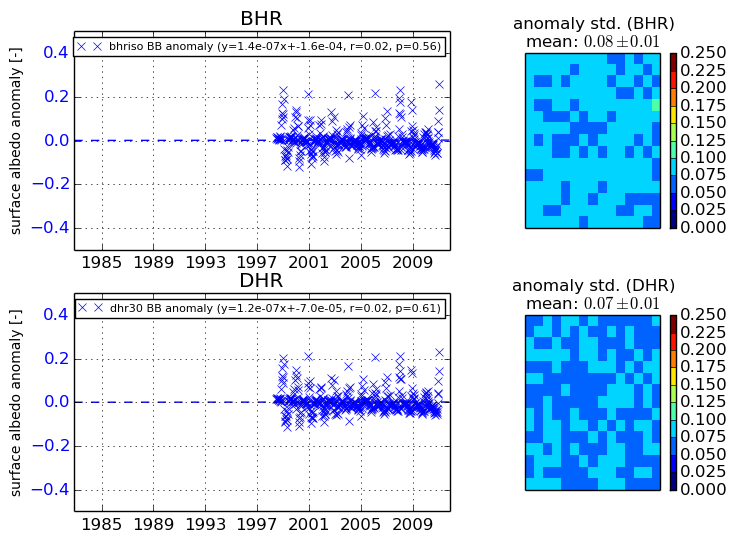
The variance of the temporal anomalies provides an additional measure about the stability of the signal AFTER removal of the mean seasonal cylce.
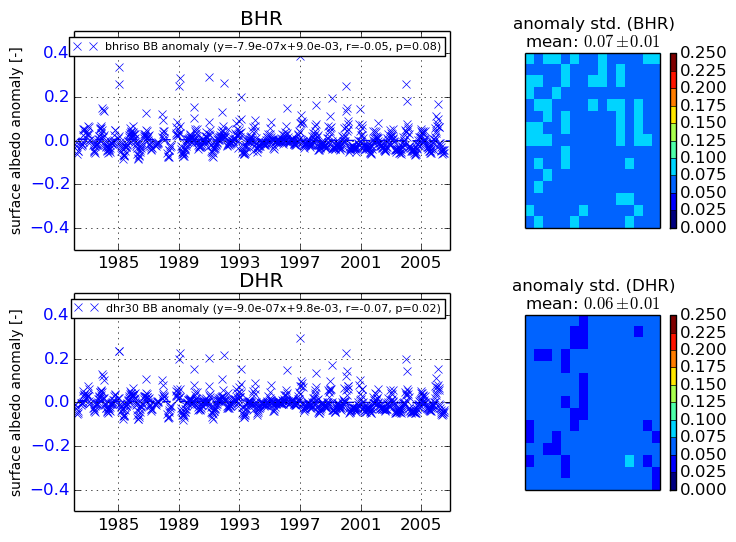
+000 deg


+057/+063 deg