SEVILLETA_LTER_SEV


Location

lon / lat [deg]: -106.88 / 34.35

Source network: LTER


Geostationary surface albedo (GSA) data


“+000”


“+057/+063”


Landcover information (based on ESA CCI landcover data)


Landcover fractions @ 2km distance


Landcover fractions @ 20 km distance


Legend


Distance to open water bodies [km]:

0.86

Distance to urban areas [km]:

0.37


Radius: 1 km

Number of landcover classes:

4

Dominant landcover type:

120: Shrubland

Fraction of dominant landcover type [%]:

62.0


Radius: 2 km

Number of landcover classes:

4

Dominant landcover type:

120: Shrubland

Fraction of dominant landcover type [%]:

57.0


Radius: 5 km

Number of landcover classes:

6

Dominant landcover type:

120: Shrubland

Fraction of dominant landcover type [%]:

64.0


Radius: 10 km

Number of landcover classes:

5

Dominant landcover type:

120: Shrubland

Fraction of dominant landcover type [%]:

74.0


Radius: 20 km

Number of landcover classes:

3

Dominant landcover type:

120: Shrubland

Fraction of dominant landcover type [%]:

72.0


Disturbances


Heterogeneity analysis

The heterogeneity analysis provides information about the spatial and temporal heterogeneity of the site.

Topography


Roman et al. (2009) index


St

75.8451896032

Rcv

0.00709089401188

Rse

0.0

Rst

2.46132224679e-07

Rsv

-0.0324631152503


Height range @ 1km [m]

52

Height range @ 2km [m]

95

Height range @ 5km [m]

106

Height range @ 10km [m]

-999

Height range @ 20km [m]

-999


Variance slope @ 1 km

156

Variance slope @ 2 km

200

Variance slope @ 5 km

295

Variance slope @ 10 km

-999

Variance slope @ 20 km

-999


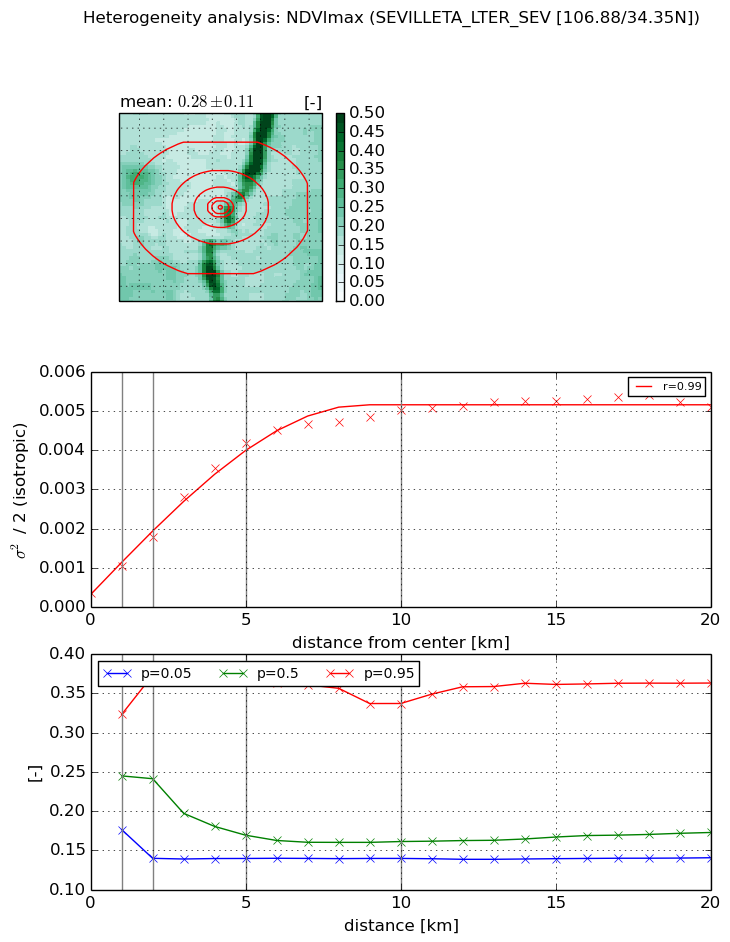
NDVI (max. NDVI composite)


Roman et al. (2009) index


St

23.6153723543

Rcv

-0.0330813107747

Rse

0.0

Rst

-0.0103090205367

Rsv

-0.0836455652646


NDVI range @ 1km [-]

0.15

NDVI range @ 2km [-]

0.23

NDVI range @ 5km [-]

0.23

NDVI range @ 10km [-]

0.2

NDVI range @ 20km [-]

0.22


Variance slope @ 1 km

0.000684414668982

Variance slope @ 2 km

0.000710266298162

Variance slope @ 5 km

0.000789332792118

Variance slope @ 10 km

0.000473297242893

Variance slope @ 20 km

0.000199465081693


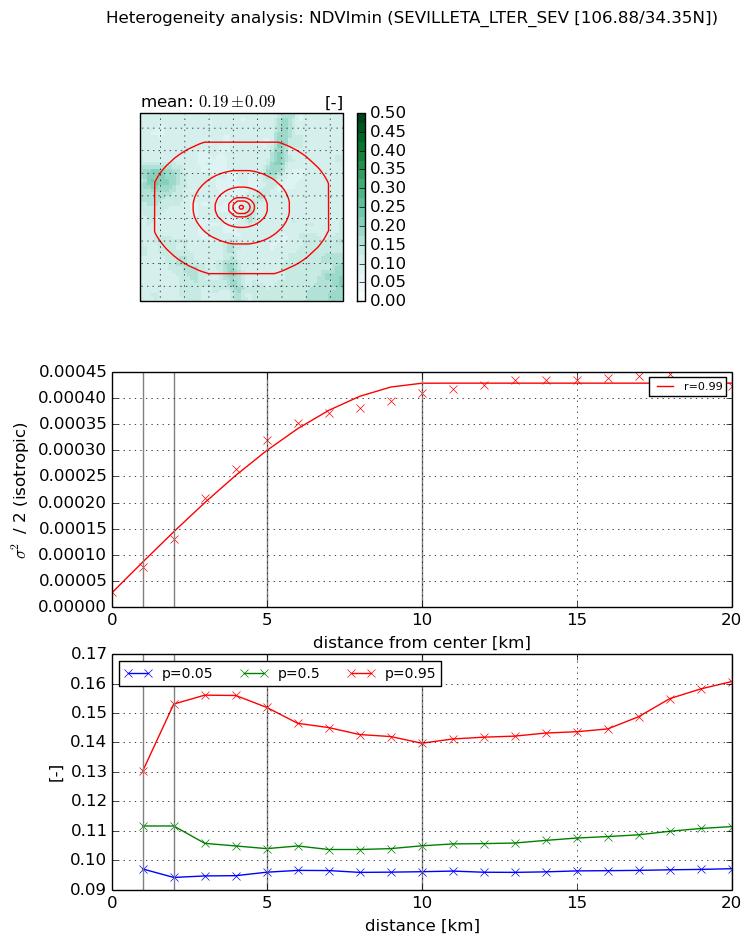
NDVI (min. NDVI composite)I


Roman et al. (2009) index


St

22.2421799813

Rcv

-0.121680808837

Rse

0.0

Rst

-0.0102656457558

Rsv

0.00293241081125


NDVI range @ 1km [-]

0.03

NDVI range @ 2km [-]

0.06

NDVI range @ 5km [-]

0.06

NDVI range @ 10km [-]

0.04

NDVI range @ 20km [-]

0.06


NDVI slope @ 1 km

4.86464581457e-05

NDVI slope @ 2 km

5.14820285207e-05

NDVI slope @ 5 km

5.99799753634e-05

NDVI slope @ 10 km

3.94112335779e-05

NDVI slope @ 20 km

1.76068870177e-05


Temporal stability analysis

+000 deg (BHR)


BHR statistics

Temporal stability [1/decade]:


abs

rel


Weighted least square:

None


Ordinary least square:

None


Probabilities that GCOS criteria is met:

Weighted least square:

None %

Ordinary least square:

None %


DHR statistics

Temporal stability [1/decade]:


abs

rel


Weighted least square:

None


Ordinary least square:

None


Probabilities that GCOS criteria is met:

Weighted least square:

None %

Ordinary least square:

None %


+057/+063 deg (BHR)


BHR statistics

Temporal stability [1/decade]:


abs

rel


Weighted least square:

None


Ordinary least square:

None


Probabilities that GCOS criteria is met:

Weighted least square:

None %

Ordinary least square:

None %


DHR statistics

Temporal stability [1/decade]:


abs

rel


Weighted least square:

None


Ordinary least square:

None


Probabilities that GCOS criteria is met:

Weighted least square:

None %

Ordinary least square:

None %


Temporal anomaly analyis

The variance of the temporal anomalies provides an additional measure about the stability of the signal AFTER removal of the mean seasonal cylce.

+000 deg


+057/+063 deg