SHOUXIAN


Location

lon / lat [deg]: 116.782 / 32.5584

Source network: AERONET


Geostationary surface albedo (GSA) data


“+000”


“+057/+063”


Landcover information (based on ESA CCI landcover data)


Landcover fractions @ 2km distance


Landcover fractions @ 20 km distance


Legend


Distance to open water bodies [km]:

1.41

Distance to urban areas [km]:

1.2


Radius: 1 km

Number of landcover classes:

3

Dominant landcover type:

20: cropland, irrigated or post-flooded

Fraction of dominant landcover type [%]:

47.0


Radius: 2 km

Number of landcover classes:

7

Dominant landcover type:

20: cropland, irrigated or post-flooded

Fraction of dominant landcover type [%]:

60.0


Radius: 5 km

Number of landcover classes:

6

Dominant landcover type:

20: cropland, irrigated or post-flooded

Fraction of dominant landcover type [%]:

48.0


Radius: 10 km

Number of landcover classes:

7

Dominant landcover type:

20: cropland, irrigated or post-flooded

Fraction of dominant landcover type [%]:

33.0


Radius: 20 km

Number of landcover classes:

6

Dominant landcover type:

20: cropland, irrigated or post-flooded

Fraction of dominant landcover type [%]:

29.0


Disturbances


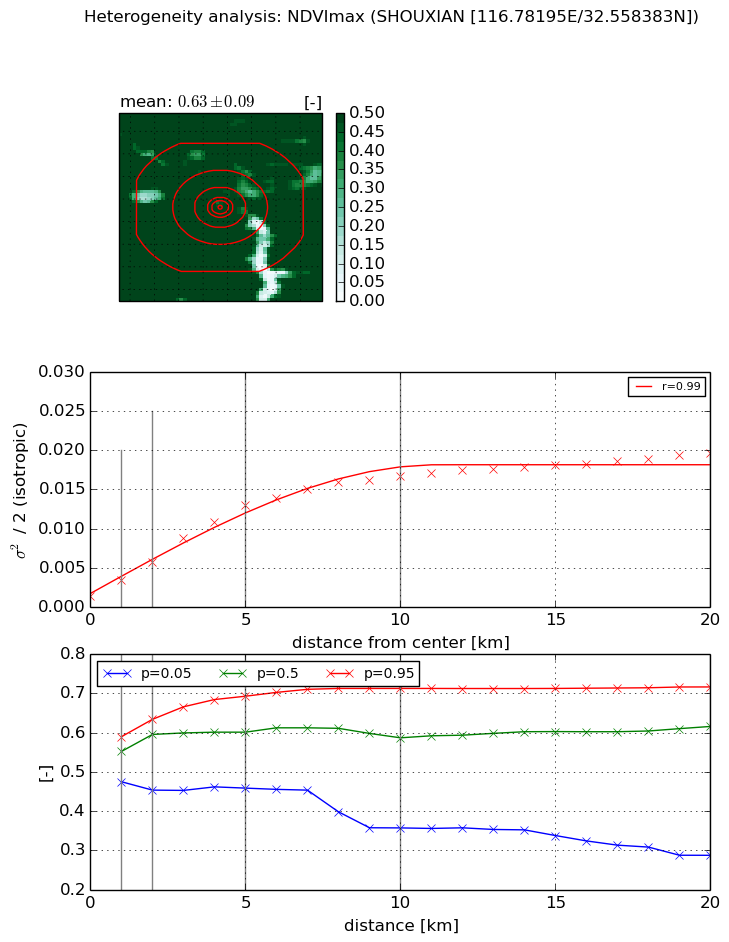
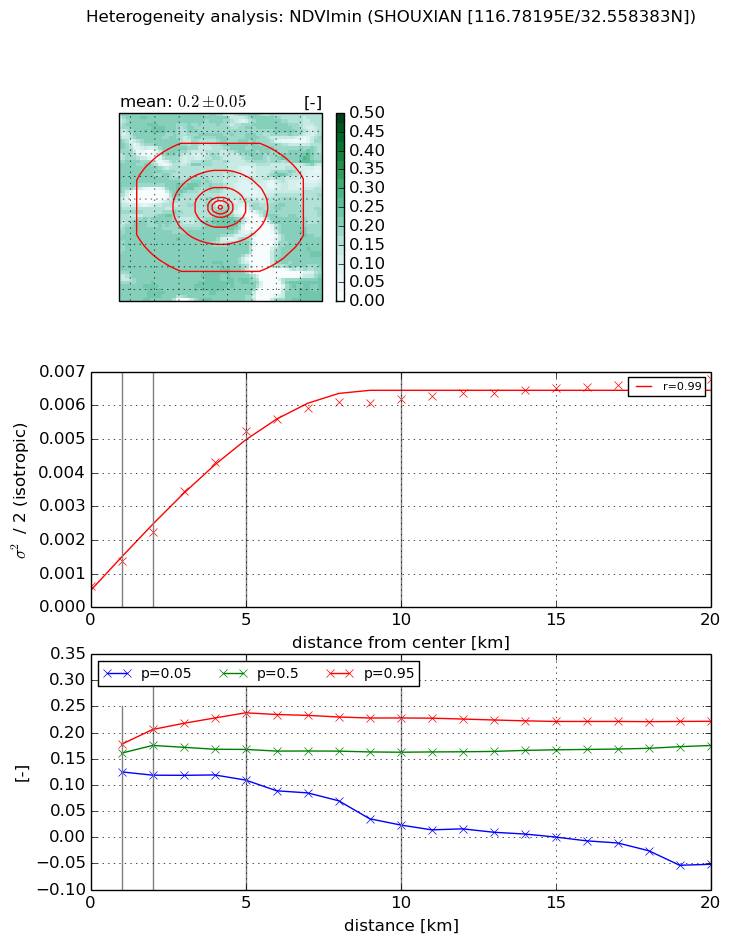
Heterogeneity analysis

The heterogeneity analysis provides information about the spatial and temporal heterogeneity of the site.

Topography


Roman et al. (2009) index


St

5.84617245981

Rcv

0.238249908968

Rse

0.0

Rst

-0.0890295965964

Rsv

0.185876755327


Height range @ 1km [m]

4

Height range @ 2km [m]

8

Height range @ 5km [m]

10

Height range @ 10km [m]

-999

Height range @ 20km [m]

-999


Variance slope @ 1 km

30

Variance slope @ 2 km

23

Variance slope @ 5 km

11

Variance slope @ 10 km

-999

Variance slope @ 20 km

-999


NDVI (max. NDVI composite)


Roman et al. (2009) index


St

1.99930227324

Rcv

0.130826479368

Rse

0.0

Rst

-0.369697308495

Rsv

-0.999999689831


NDVI range @ 1km [-]

0.11

NDVI range @ 2km [-]

0.18

NDVI range @ 5km [-]

0.23

NDVI range @ 10km [-]

0.36

NDVI range @ 20km [-]

0.43


Variance slope @ 1 km

0.00199280876103

Variance slope @ 2 km

0.00215968993671

Variance slope @ 5 km

0.0023841888949

Variance slope @ 10 km

0.00157725347424

Variance slope @ 20 km

0.000774955367757


NDVI (min. NDVI composite)I


Roman et al. (2009) index


St

1.76227740197

Rcv

0.39314612293

Rse

0.0

Rst

-0.309196747239

Rsv

-0.99999978976


NDVI range @ 1km [-]

0.05

NDVI range @ 2km [-]

0.09

NDVI range @ 5km [-]

0.13

NDVI range @ 10km [-]

0.2

NDVI range @ 20km [-]

0.27


NDVI slope @ 1 km

0.000722627541612

NDVI slope @ 2 km

0.000796496847702

NDVI slope @ 5 km

0.00094621332729

NDVI slope @ 10 km

0.000586059424733

NDVI slope @ 20 km

0.000249749233489


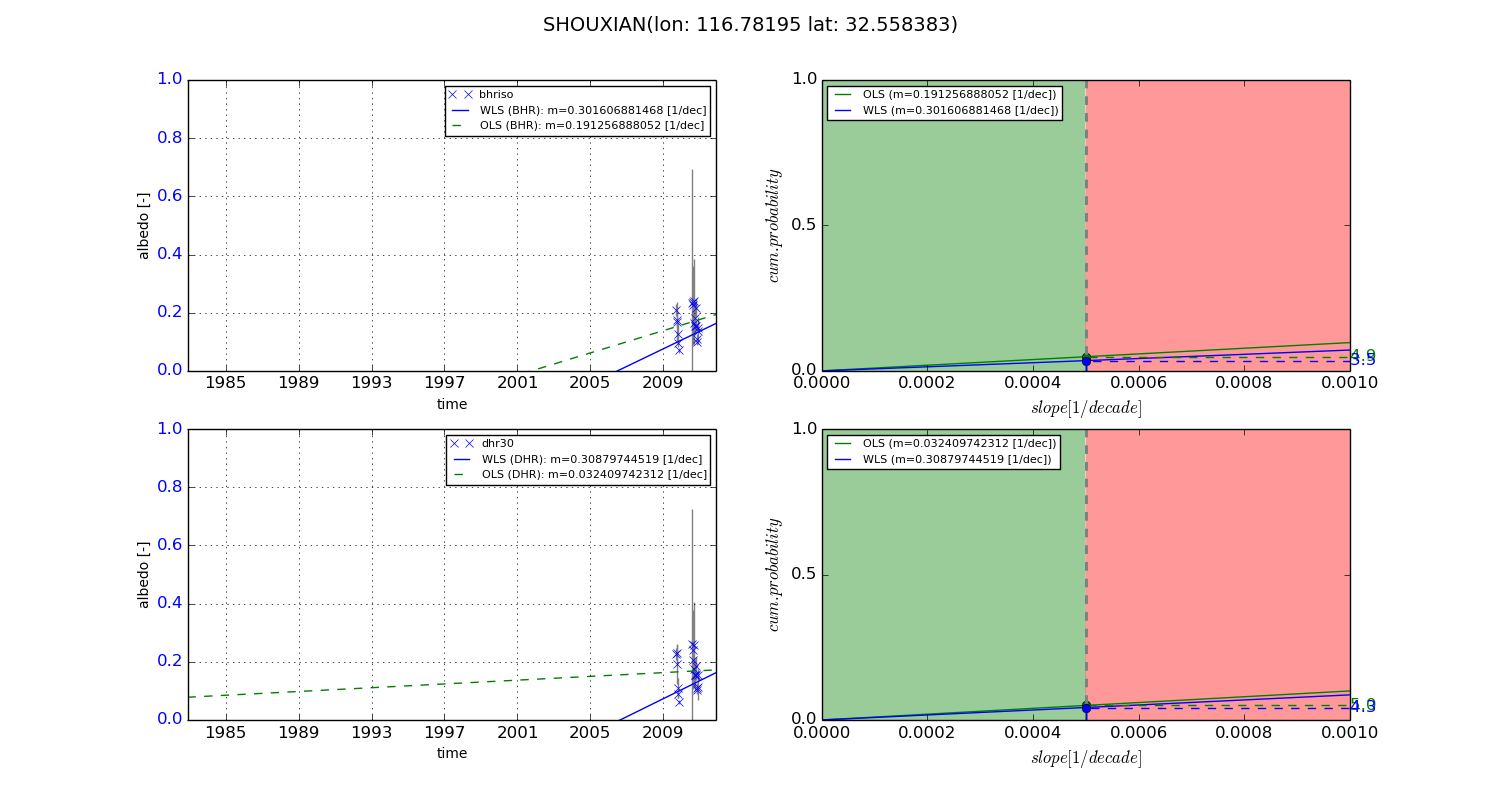
Temporal stability analysis

+000 deg (BHR)


BHR statistics

Temporal stability [1/decade]:


abs

rel


Weighted least square:

None


Ordinary least square:

None


Probabilities that GCOS criteria is met:

Weighted least square:

None %

Ordinary least square:

None %


DHR statistics

Temporal stability [1/decade]:


abs

rel


Weighted least square:

None


Ordinary least square:

None


Probabilities that GCOS criteria is met:

Weighted least square:

None %

Ordinary least square:

None %


+057/+063 deg (BHR)


BHR statistics

Temporal stability [1/decade]:


abs

rel


Weighted least square:

0.301606881468


Ordinary least square:

0.191256888052


Probabilities that GCOS criteria is met:

Weighted least square:

3.5 %

Ordinary least square:

4.9 %


DHR statistics

Temporal stability [1/decade]:


abs

rel


Weighted least square:

0.30879744519


Ordinary least square:

0.032409742312


Probabilities that GCOS criteria is met:

Weighted least square:

4.3 %

Ordinary least square:

5.0 %


Temporal anomaly analyis

The variance of the temporal anomalies provides an additional measure about the stability of the signal AFTER removal of the mean seasonal cylce.

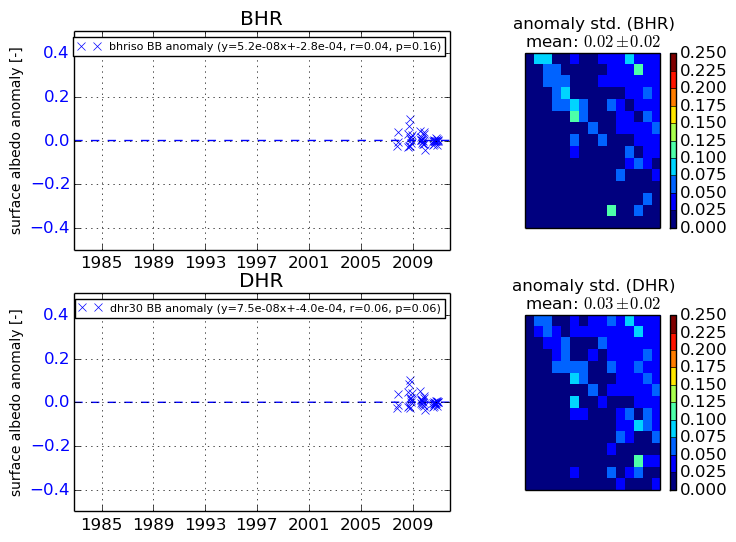
+000 deg


+057/+063 deg