SINHGAD


Location

lon / lat [deg]: 73.75 / 18.3667

Source network: AERONET


Geostationary surface albedo (GSA) data


“+000”


“+057/+063”


Landcover information (based on ESA CCI landcover data)


Landcover fractions @ 2km distance


Landcover fractions @ 20 km distance


Legend


Distance to open water bodies [km]:

3.12

Distance to urban areas [km]:

5.16


Radius: 1 km

Number of landcover classes:

4

Dominant landcover type:

130: grassland

Fraction of dominant landcover type [%]:

47.0


Radius: 2 km

Number of landcover classes:

7

Dominant landcover type:

130: grassland

Fraction of dominant landcover type [%]:

46.0


Radius: 5 km

Number of landcover classes:

8

Dominant landcover type:

130: grassland

Fraction of dominant landcover type [%]:

34.0


Radius: 10 km

Number of landcover classes:

8

Dominant landcover type:

30: mosaic cropland (>50%), natural veg. (< 50%)

Fraction of dominant landcover type [%]:

32.0


Radius: 20 km

Number of landcover classes:

10

Dominant landcover type:

30: mosaic cropland (>50%), natural veg. (< 50%)

Fraction of dominant landcover type [%]:

29.0


Disturbances


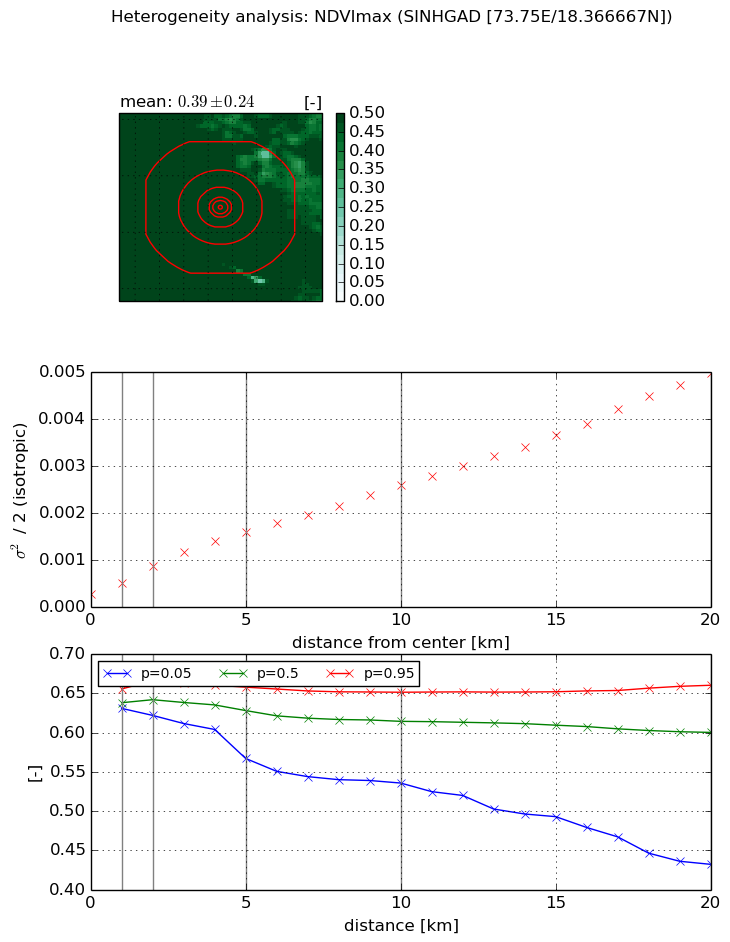
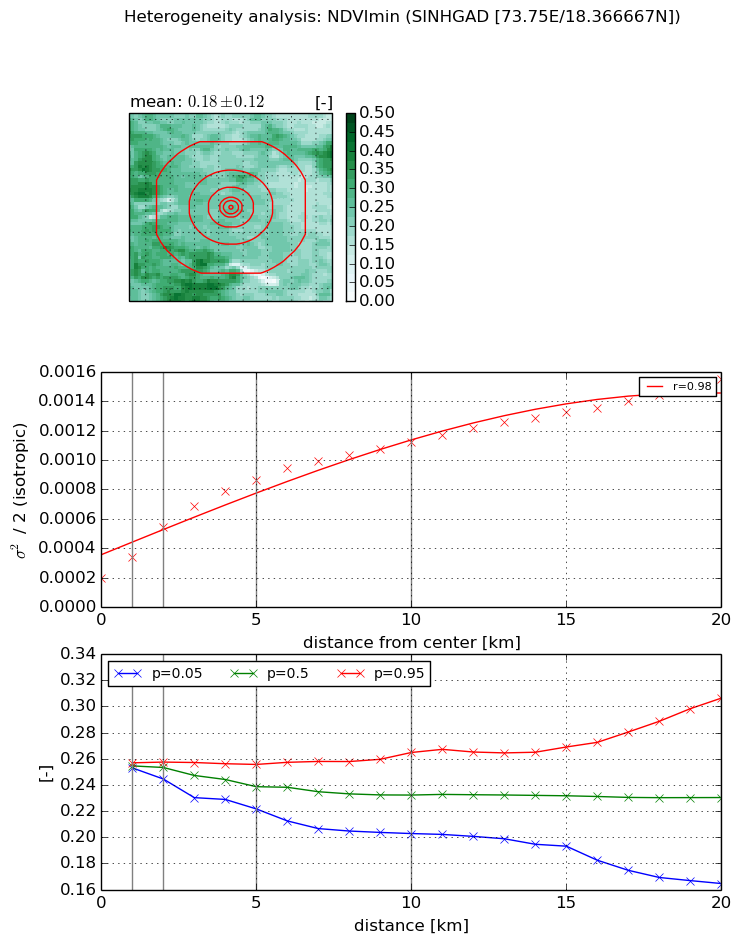
Heterogeneity analysis

The heterogeneity analysis provides information about the spatial and temporal heterogeneity of the site.

Topography


Roman et al. (2009) index


St

2.7465324153

Rcv

0.172574585574

Rse

0.0

Rst

-0.0519371957801

Rsv

0.867774617047


Height range @ 1km [m]

412

Height range @ 2km [m]

477

Height range @ 5km [m]

492

Height range @ 10km [m]

-999

Height range @ 20km [m]

-999


Variance slope @ 1 km

6293

Variance slope @ 2 km

5493

Variance slope @ 5 km

5221

Variance slope @ 10 km

-999

Variance slope @ 20 km

-999


NDVI (max. NDVI composite)


Roman et al. (2009) index


St

2.05717820432

Rcv

0.753684298223

Rse

0.0

Rst

-0.20196035653

Rsv

0.502663620975


NDVI range @ 1km [-]

0.02

NDVI range @ 2km [-]

0.04

NDVI range @ 5km [-]

0.09

NDVI range @ 10km [-]

0.12

NDVI range @ 20km [-]

0.23


Variance slope @ 1 km

0.000229346440058

Variance slope @ 2 km

0.000293856524661

Variance slope @ 5 km

0.00027310887325

Variance slope @ 10 km

0.000225385822176

Variance slope @ 20 km

0.000223679067233


NDVI (min. NDVI composite)I


Roman et al. (2009) index


St

2.69269545779

Rcv

0.324034757224

Rse

0.0

Rst

-0.250418672

Rsv

0.539671820744


NDVI range @ 1km [-]

0.0

NDVI range @ 2km [-]

0.01

NDVI range @ 5km [-]

0.03

NDVI range @ 10km [-]

0.06

NDVI range @ 20km [-]

0.14


NDVI slope @ 1 km

0.000142277268601

NDVI slope @ 2 km

0.000172954733651

NDVI slope @ 5 km

0.000137847841772

NDVI slope @ 10 km

8.90232214363e-05

NDVI slope @ 20 km

5.76149768421e-05


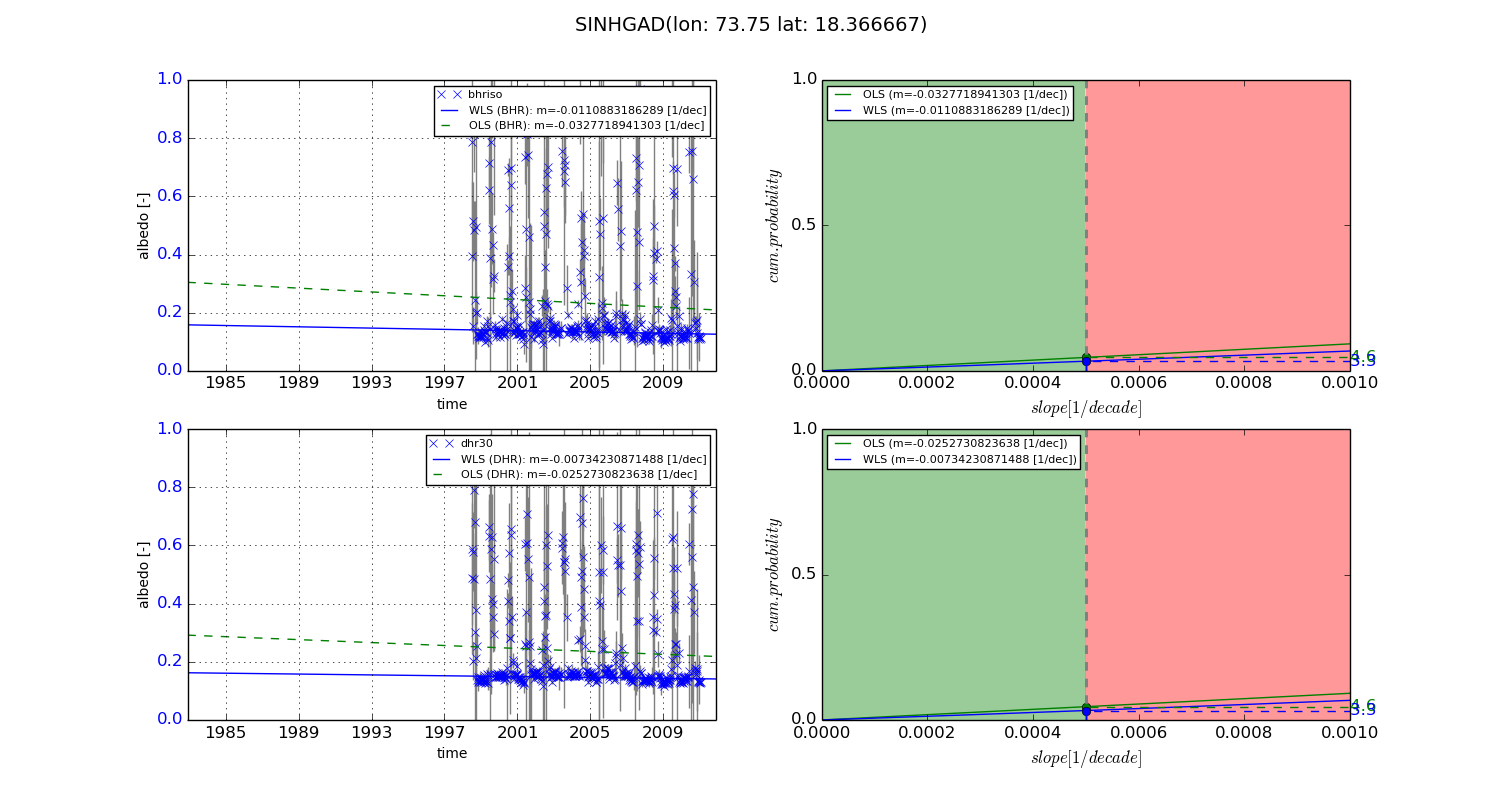
Temporal stability analysis

+000 deg (BHR)


BHR statistics

Temporal stability [1/decade]:


abs

rel


Weighted least square:

-99999.0


Ordinary least square:

-99999.0


Probabilities that GCOS criteria is met:

Weighted least square:

-99999.0 %

Ordinary least square:

-99999.0 %


DHR statistics

Temporal stability [1/decade]:


abs

rel


Weighted least square:

-99999.0


Ordinary least square:

-99999.0


Probabilities that GCOS criteria is met:

Weighted least square:

-99999.0 %

Ordinary least square:

-99999.0 %


+057/+063 deg (BHR)


BHR statistics

Temporal stability [1/decade]:


abs

rel


Weighted least square:

-0.0110883186289


Ordinary least square:

-0.0327718941303


Probabilities that GCOS criteria is met:

Weighted least square:

3.3 %

Ordinary least square:

4.6 %


DHR statistics

Temporal stability [1/decade]:


abs

rel


Weighted least square:

-0.00734230871488


Ordinary least square:

-0.0252730823638


Probabilities that GCOS criteria is met:

Weighted least square:

3.3 %

Ordinary least square:

4.6 %


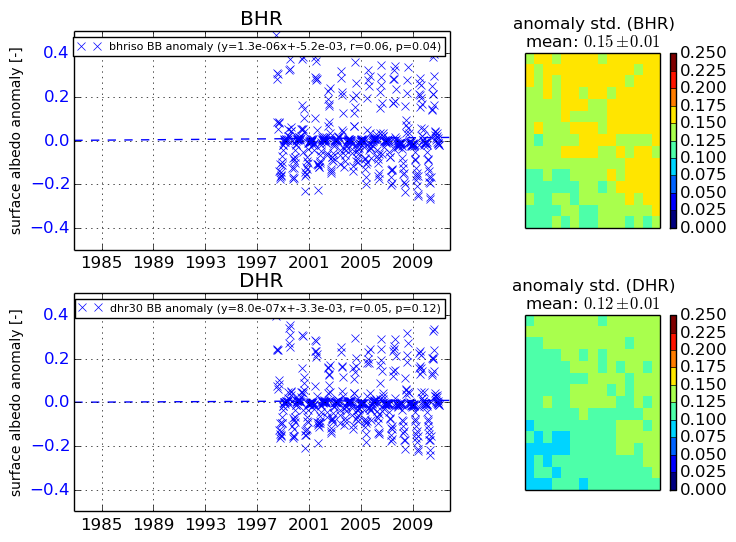
Temporal anomaly analyis

The variance of the temporal anomalies provides an additional measure about the stability of the signal AFTER removal of the mean seasonal cylce.

+000 deg


+057/+063 deg