SMART


Location

lon / lat [deg]: 55.6121 / 24.2493

Source network: AERONET


Geostationary surface albedo (GSA) data


“+000”


“+057/+063”


Landcover information (based on ESA CCI landcover data)


Landcover fractions @ 2km distance


Landcover fractions @ 20 km distance


Legend


Distance to open water bodies [km]:

5.71

Distance to urban areas [km]:

1.63


Radius: 1 km

Number of landcover classes:

1

Dominant landcover type:

200: bare areas

Fraction of dominant landcover type [%]:

100.0


Radius: 2 km

Number of landcover classes:

2

Dominant landcover type:

200: bare areas

Fraction of dominant landcover type [%]:

96.0


Radius: 5 km

Number of landcover classes:

3

Dominant landcover type:

200: bare areas

Fraction of dominant landcover type [%]:

72.0


Radius: 10 km

Number of landcover classes:

4

Dominant landcover type:

200: bare areas

Fraction of dominant landcover type [%]:

73.0


Radius: 20 km

Number of landcover classes:

5

Dominant landcover type:

200: bare areas

Fraction of dominant landcover type [%]:

78.0


Disturbances


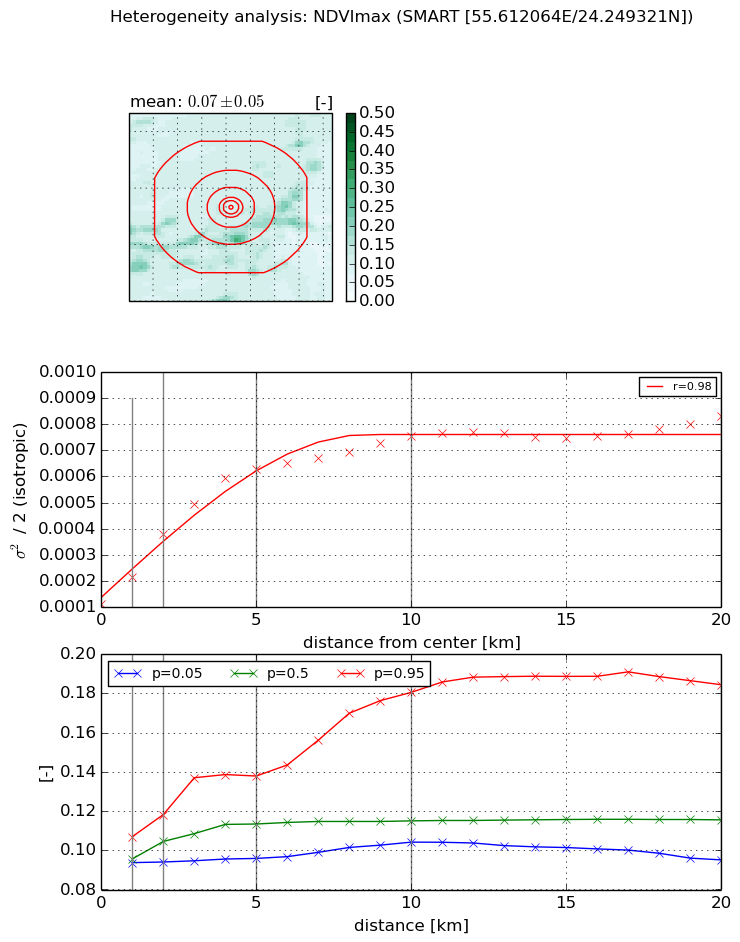
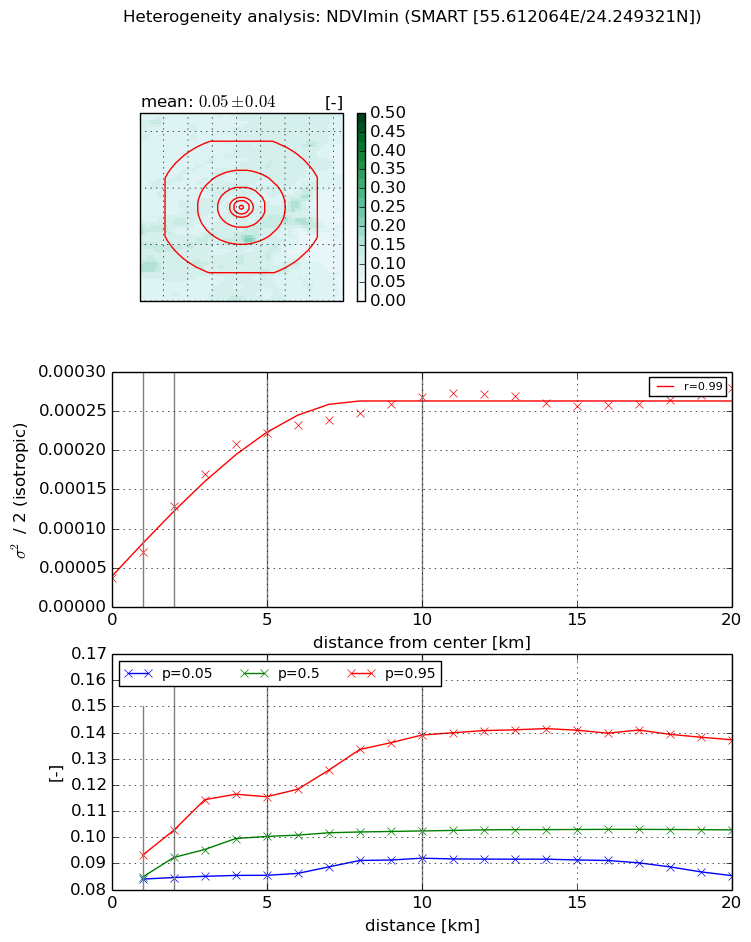
Heterogeneity analysis

The heterogeneity analysis provides information about the spatial and temporal heterogeneity of the site.

Topography


Roman et al. (2009) index


St

0.000752066475322

Rcv

0.235759358315

Rse

0.0

Rst

-0.020090733288

Rsv

3988.75323148


Height range @ 1km [m]

19

Height range @ 2km [m]

33

Height range @ 5km [m]

54

Height range @ 10km [m]

-999

Height range @ 20km [m]

-999


Variance slope @ 1 km

82

Variance slope @ 2 km

69

Variance slope @ 5 km

50

Variance slope @ 10 km

-999

Variance slope @ 20 km

-999


NDVI (max. NDVI composite)


Roman et al. (2009) index


St

6.00226538803

Rcv

-0.172762918063

Rse

0.0

Rst

-0.315969715206

Rsv

0.0110786556455


NDVI range @ 1km [-]

0.01

NDVI range @ 2km [-]

0.02

NDVI range @ 5km [-]

0.04

NDVI range @ 10km [-]

0.08

NDVI range @ 20km [-]

0.09


Variance slope @ 1 km

0.0001003580154

Variance slope @ 2 km

0.000133446772354

Variance slope @ 5 km

0.00010901579239

Variance slope @ 10 km

6.01488643892e-05

Variance slope @ 20 km

2.59563168168e-05


NDVI (min. NDVI composite)I


Roman et al. (2009) index


St

2.54167219516

Rcv

-0.201364010995

Rse

0.0

Rst

0.647915210268

Rsv

-0.331046080212


NDVI range @ 1km [-]

0.01

NDVI range @ 2km [-]

0.02

NDVI range @ 5km [-]

0.03

NDVI range @ 10km [-]

0.05

NDVI range @ 20km [-]

0.05


NDVI slope @ 1 km

3.35957502928e-05

NDVI slope @ 2 km

4.58458054661e-05

NDVI slope @ 5 km

3.93543405025e-05

NDVI slope @ 10 km

2.20787897957e-05

NDVI slope @ 20 km

8.65538412073e-06


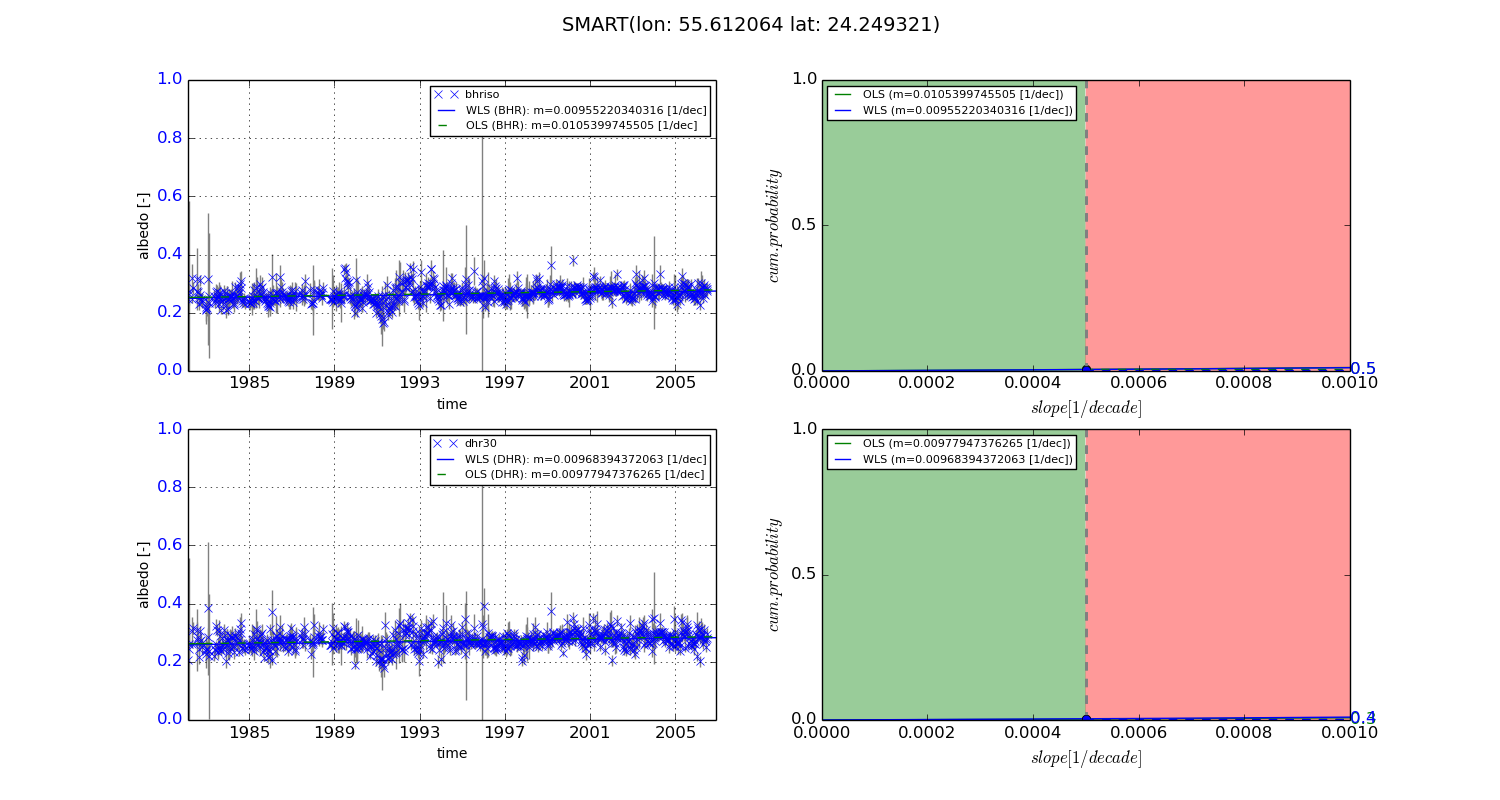
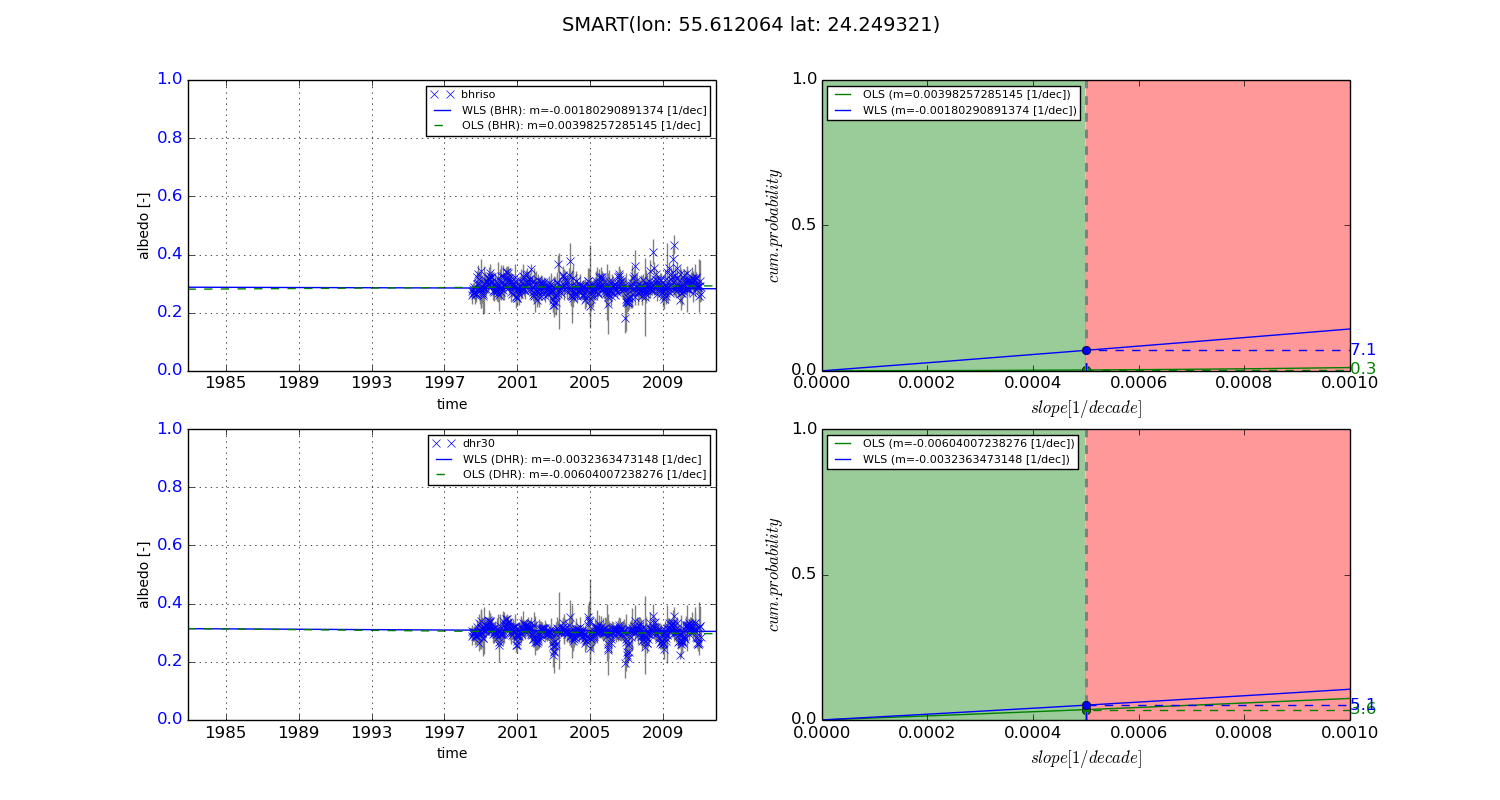
Temporal stability analysis

+000 deg (BHR)


BHR statistics

Temporal stability [1/decade]:


abs

rel


Weighted least square:

0.00955220340316


Ordinary least square:

0.0105399745505


Probabilities that GCOS criteria is met:

Weighted least square:

0.5 %

Ordinary least square:

0.5 %


DHR statistics

Temporal stability [1/decade]:


abs

rel


Weighted least square:

0.00968394372063


Ordinary least square:

0.00977947376265


Probabilities that GCOS criteria is met:

Weighted least square:

0.4 %

Ordinary least square:

0.3 %


+057/+063 deg (BHR)


BHR statistics

Temporal stability [1/decade]:


abs

rel


Weighted least square:

-0.00180290891374


Ordinary least square:

0.00398257285145


Probabilities that GCOS criteria is met:

Weighted least square:

7.1 %

Ordinary least square:

0.3 %


DHR statistics

Temporal stability [1/decade]:


abs

rel


Weighted least square:

-0.0032363473148


Ordinary least square:

-0.00604007238276


Probabilities that GCOS criteria is met:

Weighted least square:

5.1 %

Ordinary least square:

3.6 %


Temporal anomaly analyis

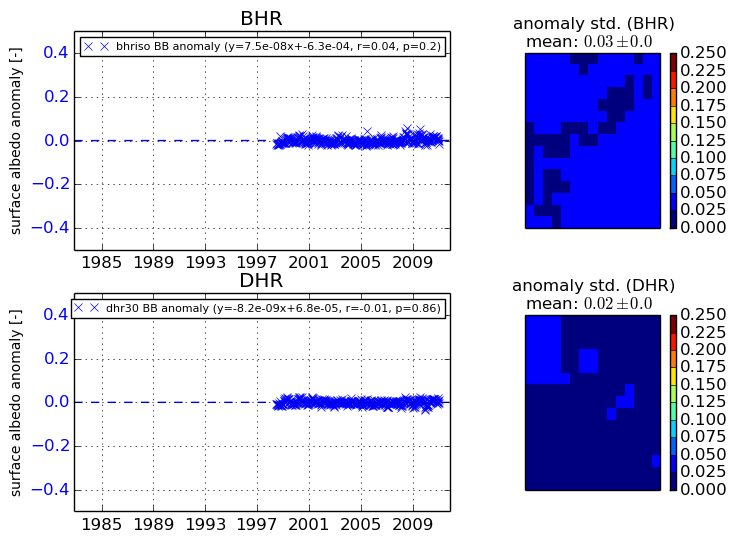
The variance of the temporal anomalies provides an additional measure about the stability of the signal AFTER removal of the mean seasonal cylce.
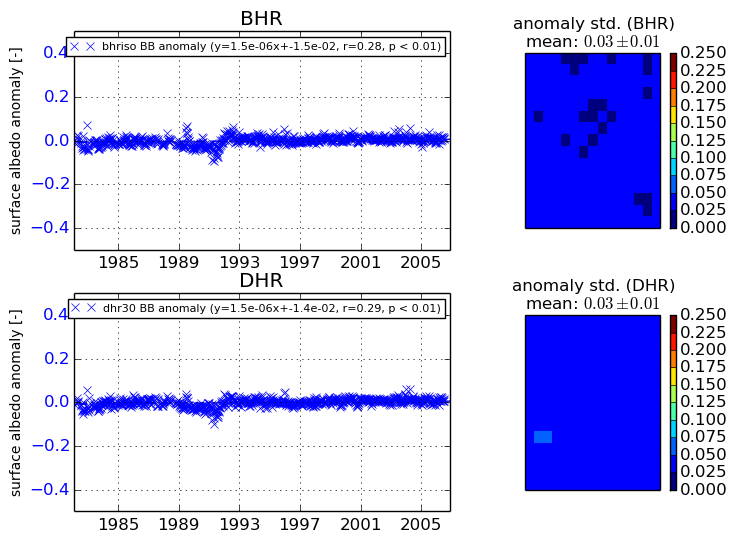
+000 deg


+057/+063 deg