SMHI


Location

lon / lat [deg]: 16.15 / 58.58

Source network: AERONET


Geostationary surface albedo (GSA) data


“+000”


“+057/+063”


Landcover information (based on ESA CCI landcover data)


Landcover fractions @ 2km distance


Landcover fractions @ 20 km distance


Legend


Distance to open water bodies [km]:

2.18

Distance to urban areas [km]:

0.12


Radius: 1 km

Number of landcover classes:

1

Dominant landcover type:

190: urban areas

Fraction of dominant landcover type [%]:

100.0


Radius: 2 km

Number of landcover classes:

3

Dominant landcover type:

190: urban areas

Fraction of dominant landcover type [%]:

77.0


Radius: 5 km

Number of landcover classes:

4

Dominant landcover type:

190: urban areas

Fraction of dominant landcover type [%]:

53.0


Radius: 10 km

Number of landcover classes:

4

Dominant landcover type:

10: cropland, rainfed

Fraction of dominant landcover type [%]:

36.0


Radius: 20 km

Number of landcover classes:

4

Dominant landcover type:

70: Tree cover, needleleaved, evergreen, closed to open (>15%)

Fraction of dominant landcover type [%]:

40.0


Disturbances


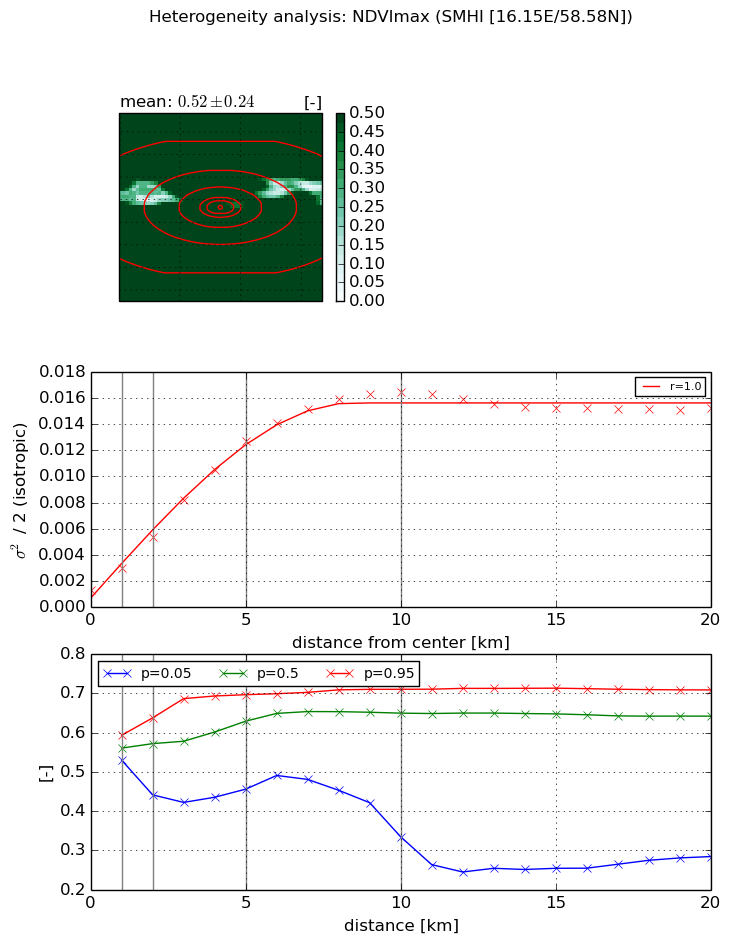
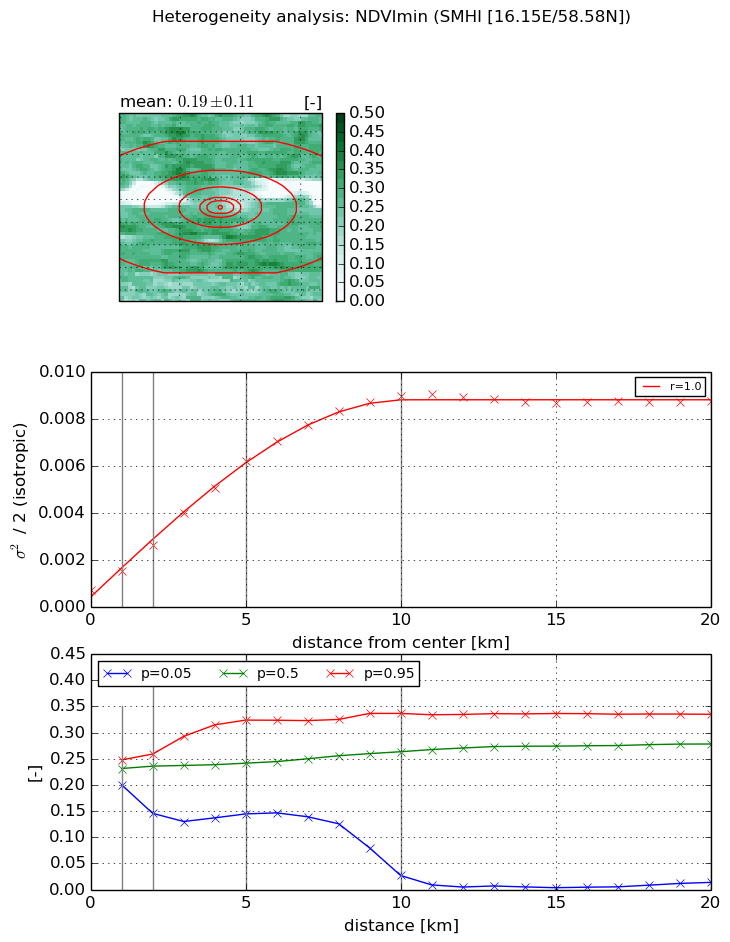
Heterogeneity analysis

The heterogeneity analysis provides information about the spatial and temporal heterogeneity of the site.

Topography


Roman et al. (2009) index


St

5.18975333649

Rcv

0.409570440535

Rse

0.0

Rst

-4.79574034347e-09

Rsv

0.168491710131


Height range @ 1km [m]

19

Height range @ 2km [m]

23

Height range @ 5km [m]

55

Height range @ 10km [m]

-999

Height range @ 20km [m]

-999


Variance slope @ 1 km

71

Variance slope @ 2 km

52

Variance slope @ 5 km

45

Variance slope @ 10 km

-999

Variance slope @ 20 km

-999


NDVI (max. NDVI composite)


Roman et al. (2009) index


St

8.65329873355e-10

Rcv

-0.156941208216

Rse

0.0

Rst

0.22940166796

Rsv

3466885972.67


NDVI range @ 1km [-]

0.06

NDVI range @ 2km [-]

0.2

NDVI range @ 5km [-]

0.24

NDVI range @ 10km [-]

0.38

NDVI range @ 20km [-]

0.42


Variance slope @ 1 km

0.00162362208785

Variance slope @ 2 km

0.00200863596799

Variance slope @ 5 km

0.00234551695332

Variance slope @ 10 km

0.00161917538653

Variance slope @ 20 km

0.000548425227367


NDVI (min. NDVI composite)I


Roman et al. (2009) index


St

0.544754318559

Rcv

0.0372981518761

Rse

0.0

Rst

1.08726810133e-08

Rsv

5.46977153417


NDVI range @ 1km [-]

0.05

NDVI range @ 2km [-]

0.11

NDVI range @ 5km [-]

0.18

NDVI range @ 10km [-]

0.31

NDVI range @ 20km [-]

0.32


NDVI slope @ 1 km

0.000800094092384

NDVI slope @ 2 km

0.000968155532117

NDVI slope @ 5 km

0.00112778492358

NDVI slope @ 10 km

0.00087935604769

NDVI slope @ 20 km

0.0003538123162


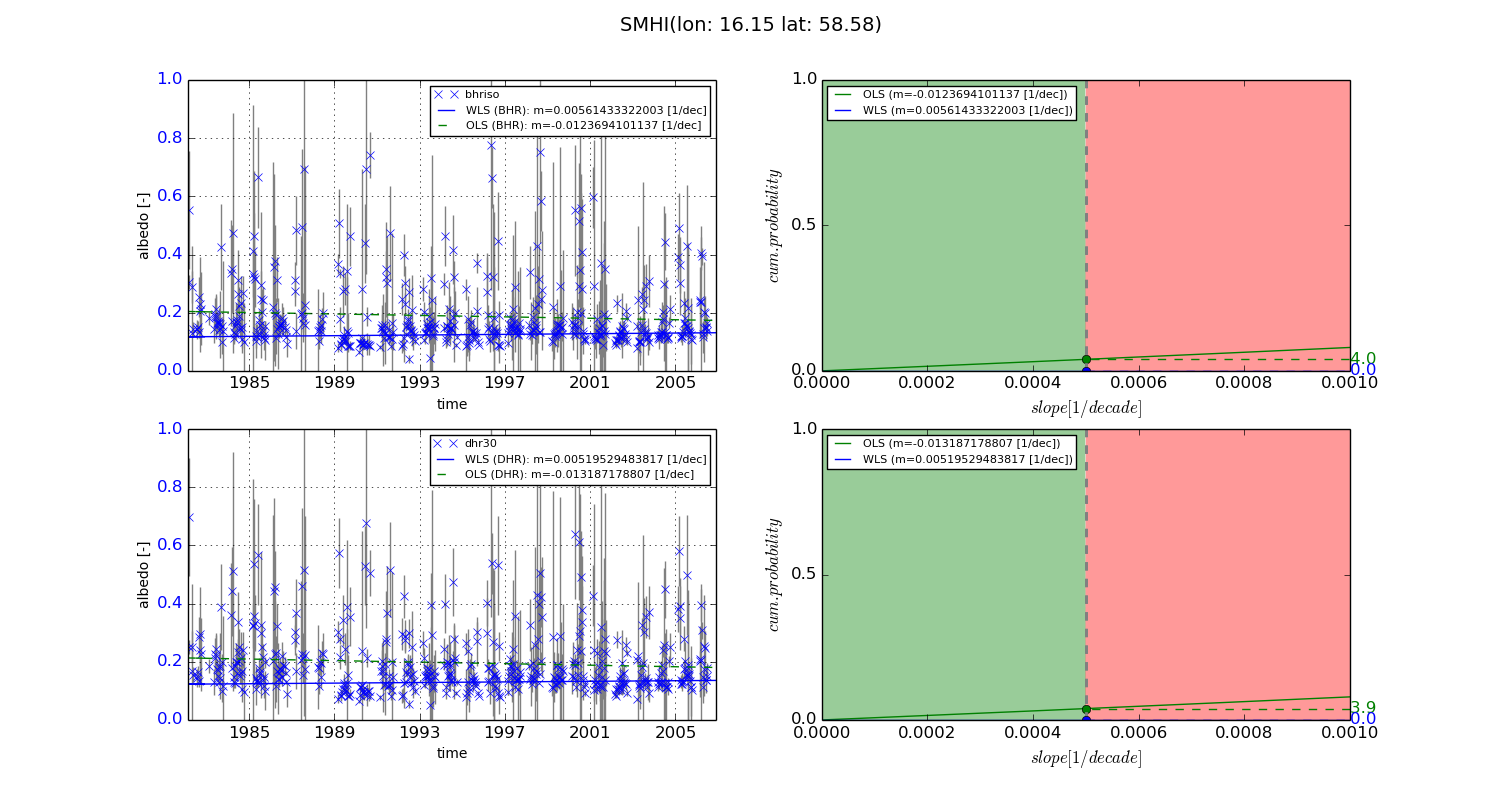
Temporal stability analysis

+000 deg (BHR)


BHR statistics

Temporal stability [1/decade]:


abs

rel


Weighted least square:

0.00561433322003


Ordinary least square:

-0.0123694101137


Probabilities that GCOS criteria is met:

Weighted least square:

0.0 %

Ordinary least square:

4.0 %


DHR statistics

Temporal stability [1/decade]:


abs

rel


Weighted least square:

0.00519529483817


Ordinary least square:

-0.013187178807


Probabilities that GCOS criteria is met:

Weighted least square:

0.0 %

Ordinary least square:

3.9 %


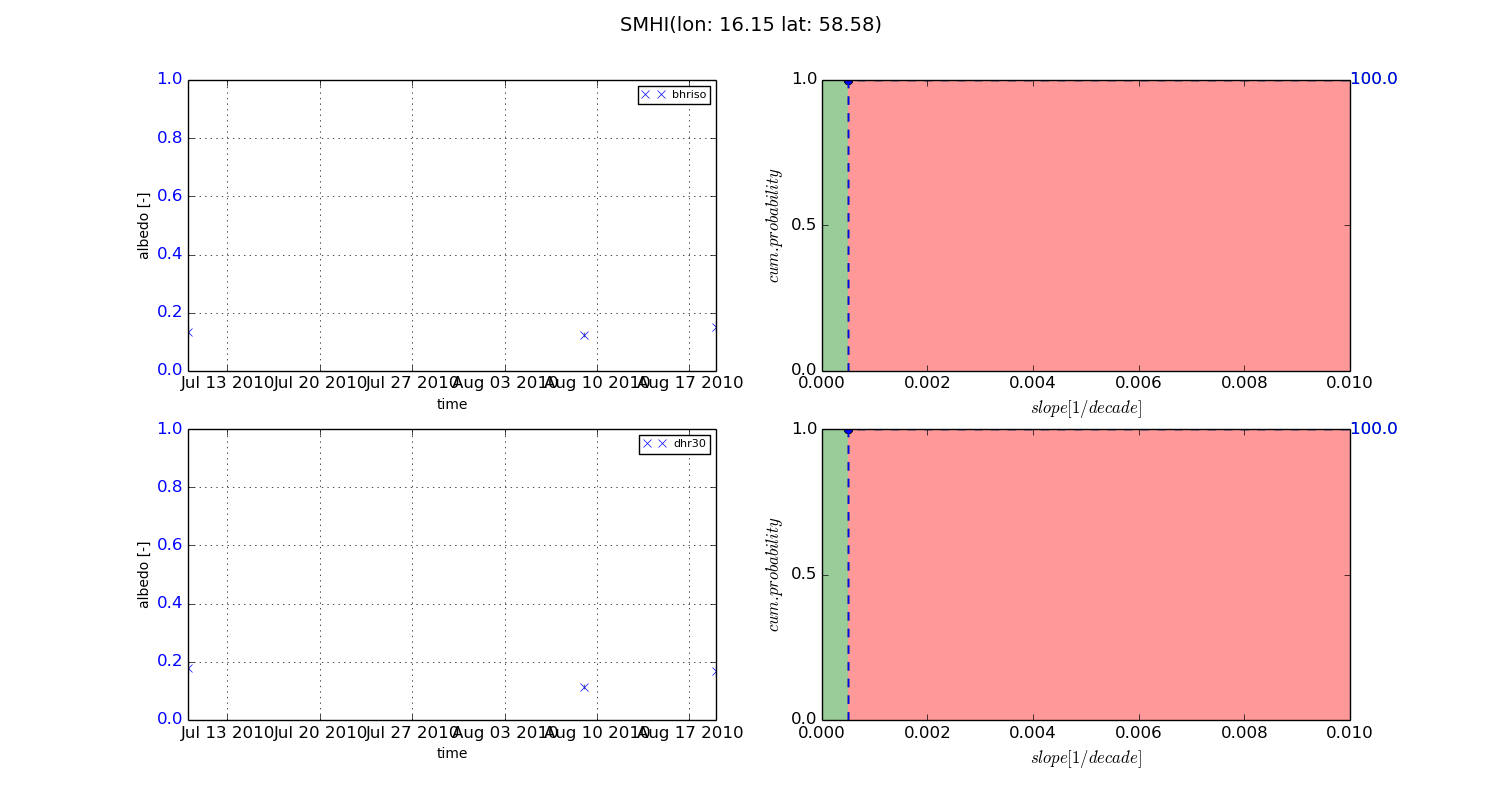
+057/+063 deg (BHR)


BHR statistics

Temporal stability [1/decade]:


abs

rel


Weighted least square:

-99999.0


Ordinary least square:

-99999.0


Probabilities that GCOS criteria is met:

Weighted least square:

-99999.0 %

Ordinary least square:

-99999.0 %


DHR statistics

Temporal stability [1/decade]:


abs

rel


Weighted least square:

-99999.0


Ordinary least square:

-99999.0


Probabilities that GCOS criteria is met:

Weighted least square:

-99999.0 %

Ordinary least square:

-99999.0 %


Temporal anomaly analyis

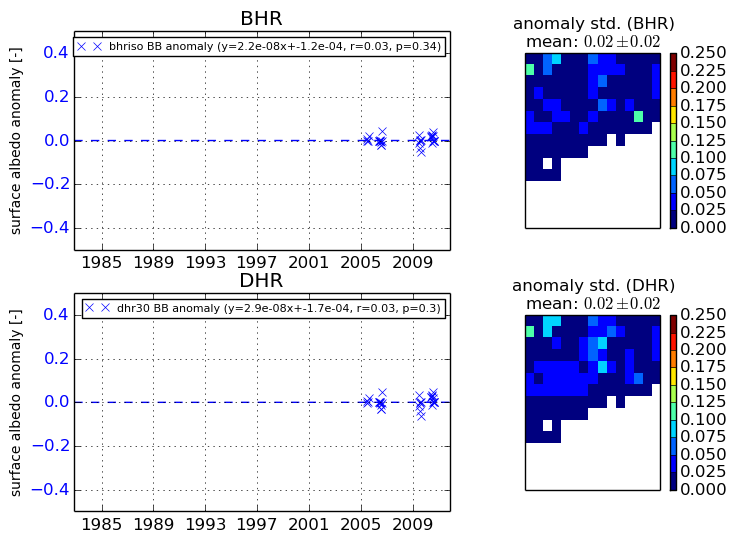
The variance of the temporal anomalies provides an additional measure about the stability of the signal AFTER removal of the mean seasonal cylce.
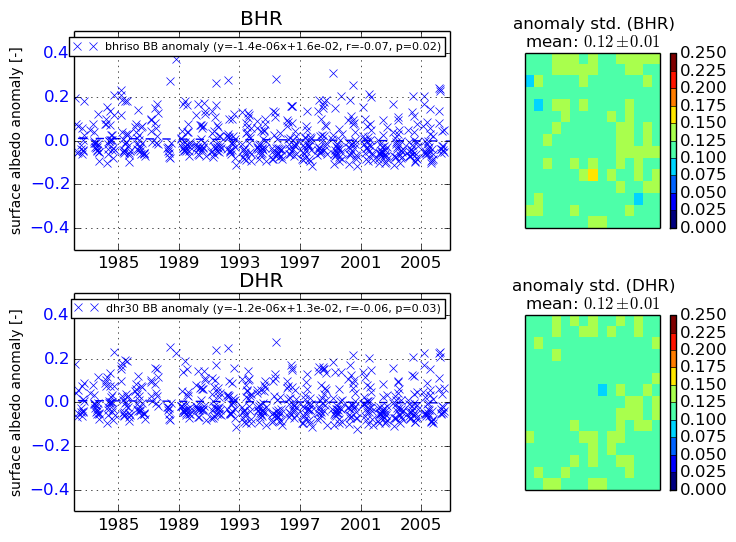
+000 deg


+057/+063 deg