SODANKYLA


Location

lon / lat [deg]: 26.6296 / 67.3666

Source network: AERONET


Geostationary surface albedo (GSA) data


“+000”


“+057/+063”


Landcover information (based on ESA CCI landcover data)


Landcover fractions @ 2km distance


Landcover fractions @ 20 km distance


Legend


Distance to open water bodies [km]:

0.2

Distance to urban areas [km]:

2.34


Radius: 1 km

Number of landcover classes:

5

Dominant landcover type:

70: Tree cover, needleleaved, evergreen, closed to open (>15%)

Fraction of dominant landcover type [%]:

66.0


Radius: 2 km

Number of landcover classes:

6

Dominant landcover type:

70: Tree cover, needleleaved, evergreen, closed to open (>15%)

Fraction of dominant landcover type [%]:

61.0


Radius: 5 km

Number of landcover classes:

6

Dominant landcover type:

70: Tree cover, needleleaved, evergreen, closed to open (>15%)

Fraction of dominant landcover type [%]:

69.0


Radius: 10 km

Number of landcover classes:

7

Dominant landcover type:

70: Tree cover, needleleaved, evergreen, closed to open (>15%)

Fraction of dominant landcover type [%]:

74.0


Radius: 20 km

Number of landcover classes:

6

Dominant landcover type:

70: Tree cover, needleleaved, evergreen, closed to open (>15%)

Fraction of dominant landcover type [%]:

74.0


Disturbances


Heterogeneity analysis

The heterogeneity analysis provides information about the spatial and temporal heterogeneity of the site.

Topography


Roman et al. (2009) index


St

0.000223440119461

Rcv

0.424390555383

Rse

0.0

Rst

0.0444241436874

Rsv

13425.9472078


Height range @ 1km [m]

6

Height range @ 2km [m]

12

Height range @ 5km [m]

51

Height range @ 10km [m]

-999

Height range @ 20km [m]

-999


Variance slope @ 1 km

59

Variance slope @ 2 km

69

Variance slope @ 5 km

60

Variance slope @ 10 km

-999

Variance slope @ 20 km

-999


NDVI (max. NDVI composite)


Roman et al. (2009) index


St

4.77368728484

Rcv

0.151889455273

Rse

0.0

Rst

-0.0826308329032

Rsv

0.393924731574


NDVI range @ 1km [-]

0.02

NDVI range @ 2km [-]

0.05

NDVI range @ 5km [-]

0.07

NDVI range @ 10km [-]

0.1

NDVI range @ 20km [-]

0.09


Variance slope @ 1 km

0.000163961494807

Variance slope @ 2 km

0.000173689016983

Variance slope @ 5 km

0.000150965864715

Variance slope @ 10 km

8.93356668476e-05

Variance slope @ 20 km

3.58662561256e-05


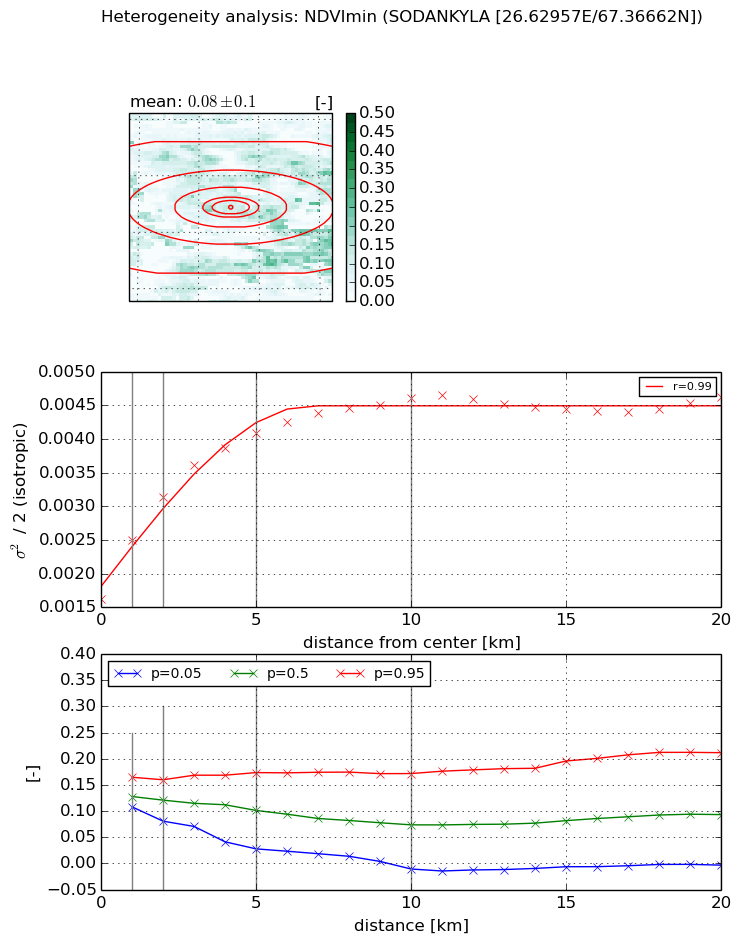
NDVI (min. NDVI composite)I


Roman et al. (2009) index


St

3.89887677522

Rcv

0.537885592898

Rse

0.0

Rst

-0.0171576978167

Rsv

0.214409085688


NDVI range @ 1km [-]

0.06

NDVI range @ 2km [-]

0.08

NDVI range @ 5km [-]

0.15

NDVI range @ 10km [-]

0.18

NDVI range @ 20km [-]

0.22


NDVI slope @ 1 km

0.000881584647193

NDVI slope @ 2 km

0.000760897459985

NDVI slope @ 5 km

0.000483835211442

NDVI slope @ 10 km

0.000263380030008

NDVI slope @ 20 km

9.2772539478e-05


Temporal stability analysis

+000 deg (BHR)


BHR statistics

Temporal stability [1/decade]:


abs

rel


Weighted least square:

-99999.0


Ordinary least square:

-99999.0


Probabilities that GCOS criteria is met:

Weighted least square:

-99999.0 %

Ordinary least square:

-99999.0 %


DHR statistics

Temporal stability [1/decade]:


abs

rel


Weighted least square:

-99999.0


Ordinary least square:

-99999.0


Probabilities that GCOS criteria is met:

Weighted least square:

-99999.0 %

Ordinary least square:

-99999.0 %


+057/+063 deg (BHR)


BHR statistics

Temporal stability [1/decade]:


abs

rel


Weighted least square:

-99999.0


Ordinary least square:

-99999.0


Probabilities that GCOS criteria is met:

Weighted least square:

-99999.0 %

Ordinary least square:

-99999.0 %


DHR statistics

Temporal stability [1/decade]:


abs

rel


Weighted least square:

-99999.0


Ordinary least square:

-99999.0


Probabilities that GCOS criteria is met:

Weighted least square:

-99999.0 %

Ordinary least square:

-99999.0 %


Temporal anomaly analyis

The variance of the temporal anomalies provides an additional measure about the stability of the signal AFTER removal of the mean seasonal cylce.

+000 deg


+057/+063 deg