SOLODKE


Location

lon / lat [deg]: 36.287 / 47.774

Source network: ALBEDOVAL2


Geostationary surface albedo (GSA) data


“+000”


“+057/+063”


Landcover information (based on ESA CCI landcover data)


Landcover fractions @ 2km distance


Landcover fractions @ 20 km distance


Legend


Distance to open water bodies [km]:

4.63

Distance to urban areas [km]:

6.06


Radius: 1 km

Number of landcover classes:

1

Dominant landcover type:

10: cropland, rainfed

Fraction of dominant landcover type [%]:

100.0


Radius: 2 km

Number of landcover classes:

1

Dominant landcover type:

10: cropland, rainfed

Fraction of dominant landcover type [%]:

100.0


Radius: 5 km

Number of landcover classes:

1

Dominant landcover type:

10: cropland, rainfed

Fraction of dominant landcover type [%]:

100.0


Radius: 10 km

Number of landcover classes:

2

Dominant landcover type:

10: cropland, rainfed

Fraction of dominant landcover type [%]:

98.0


Radius: 20 km

Number of landcover classes:

2

Dominant landcover type:

10: cropland, rainfed

Fraction of dominant landcover type [%]:

96.0


Disturbances


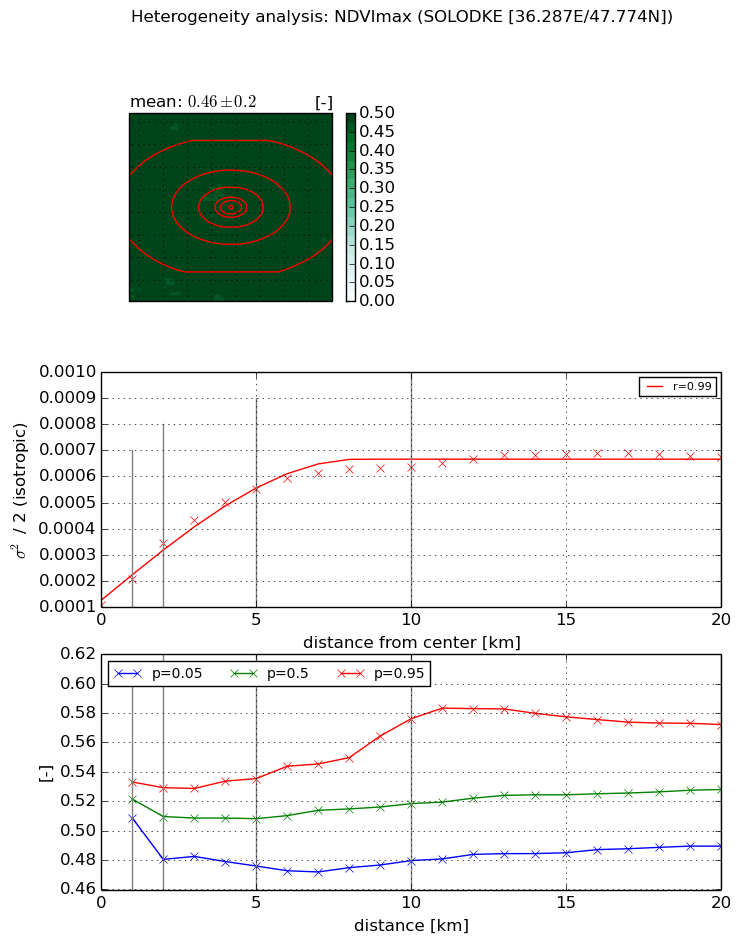
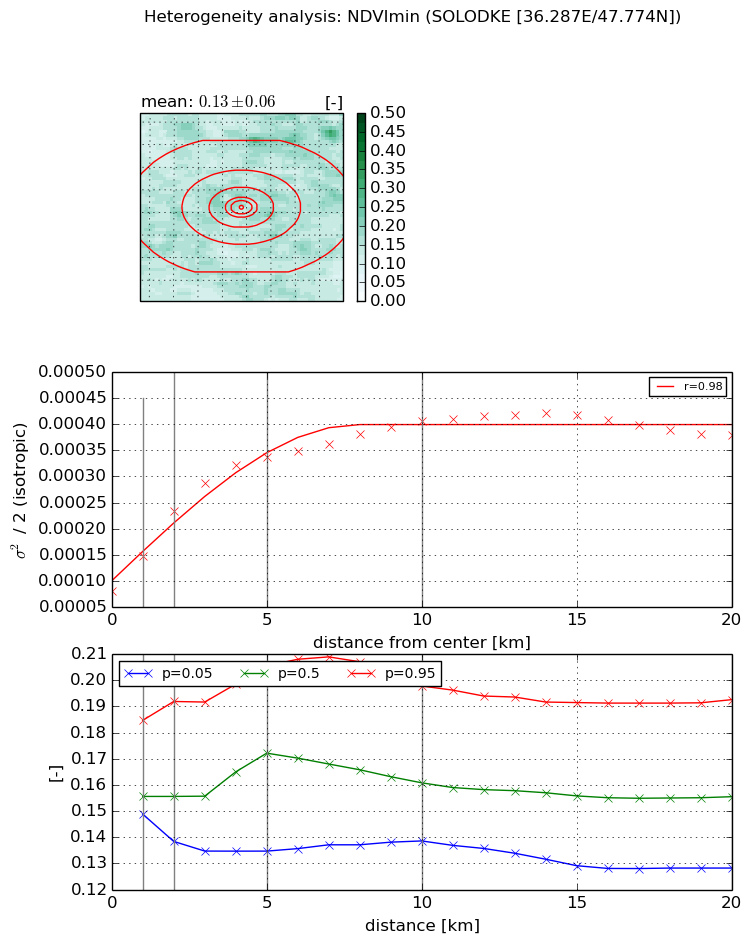
Heterogeneity analysis

The heterogeneity analysis provides information about the spatial and temporal heterogeneity of the site.

Topography


Roman et al. (2009) index


St

0.616801531

Rcv

0.547547227617

Rse

0.0

Rst

-8.98547901569e-09

Rsv

4.3162539202


Height range @ 1km [m]

12

Height range @ 2km [m]

15

Height range @ 5km [m]

30

Height range @ 10km [m]

-999

Height range @ 20km [m]

-999


Variance slope @ 1 km

30

Variance slope @ 2 km

27

Variance slope @ 5 km

23

Variance slope @ 10 km

-999

Variance slope @ 20 km

-999


NDVI (max. NDVI composite)


Roman et al. (2009) index


St

1.45897605454

Rcv

0.384711951539

Rse

0.0

Rst

-0.671529701336

Rsv

-0.999994973261


NDVI range @ 1km [-]

0.02

NDVI range @ 2km [-]

0.05

NDVI range @ 5km [-]

0.06

NDVI range @ 10km [-]

0.1

NDVI range @ 20km [-]

0.08


Variance slope @ 1 km

0.000100001312503

Variance slope @ 2 km

0.000118454824781

Variance slope @ 5 km

9.1106831446e-05

Variance slope @ 10 km

5.12716478762e-05

Variance slope @ 20 km

2.18439058437e-05


NDVI (min. NDVI composite)I


Roman et al. (2009) index


St

24.7366947994

Rcv

0.032858064804

Rse

0.0

Rst

-0.0168198018355

Rsv

0.0715994513016


NDVI range @ 1km [-]

0.04

NDVI range @ 2km [-]

0.05

NDVI range @ 5km [-]

0.07

NDVI range @ 10km [-]

0.06

NDVI range @ 20km [-]

0.06


NDVI slope @ 1 km

6.60974992798e-05

NDVI slope @ 2 km

7.5813453634e-05

NDVI slope @ 5 km

5.27746417973e-05

NDVI slope @ 10 km

2.93469146162e-05

NDVI slope @ 20 km

1.11318256631e-05


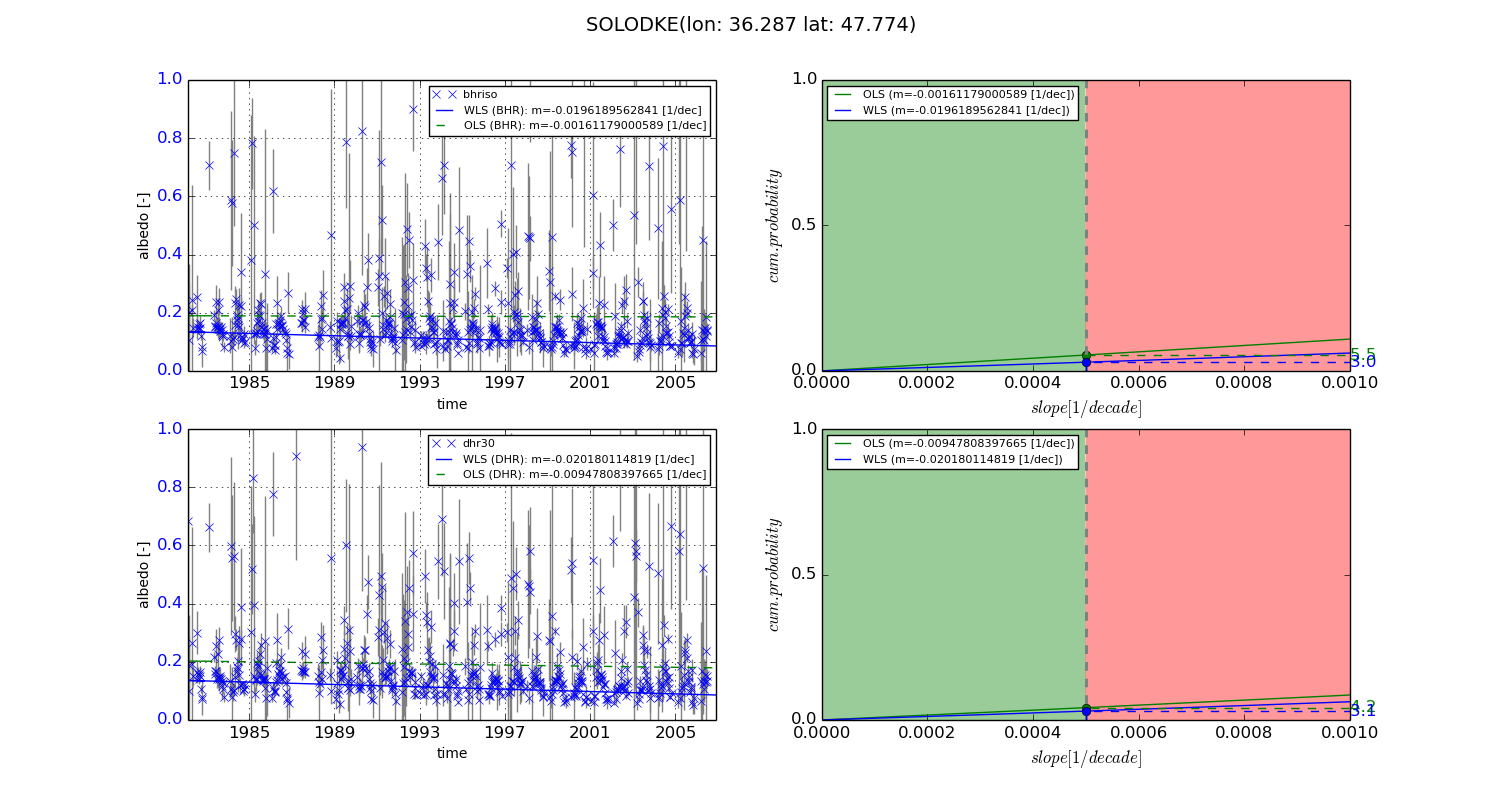
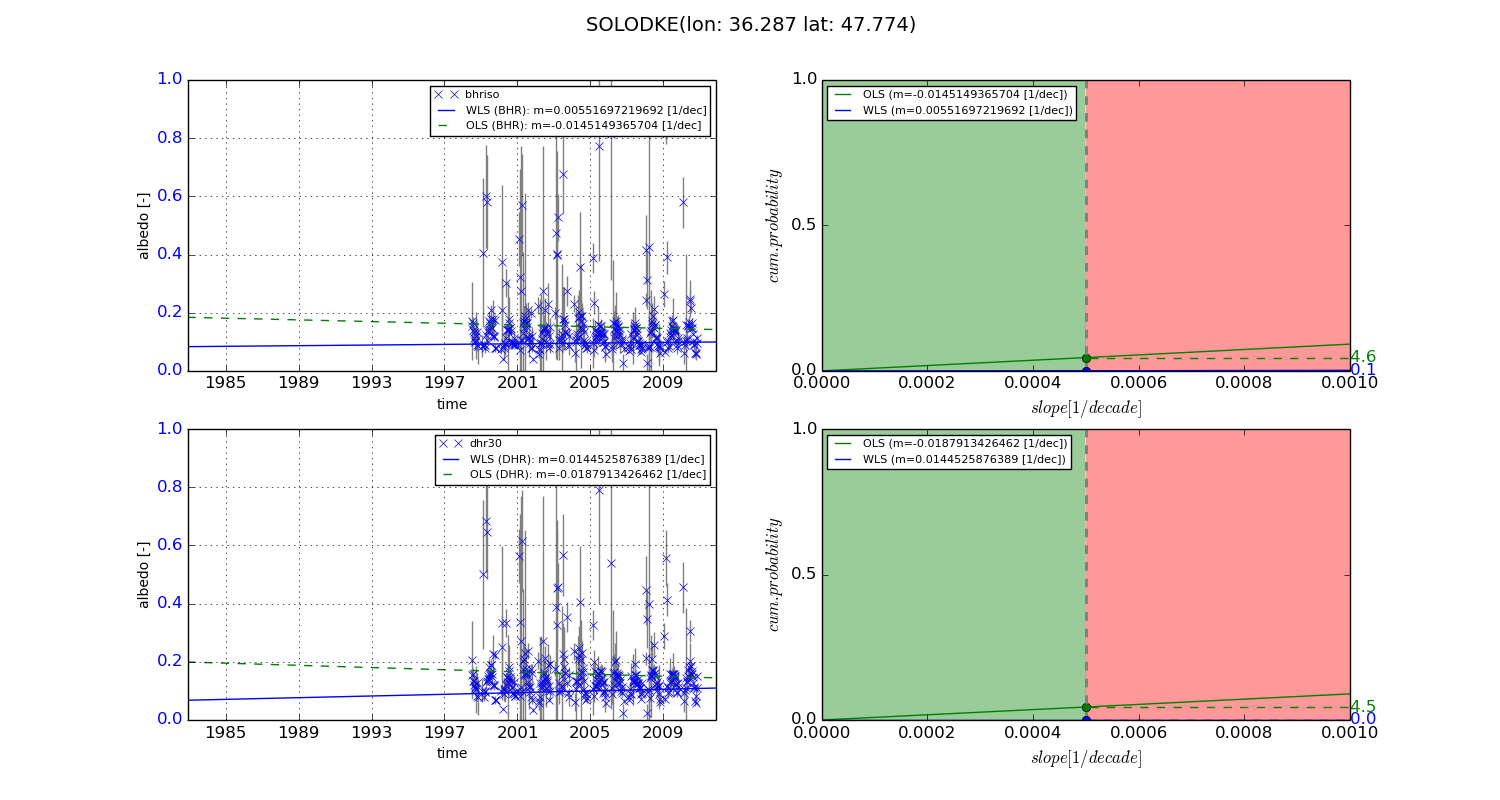
Temporal stability analysis

+000 deg (BHR)


BHR statistics

Temporal stability [1/decade]:


abs

rel


Weighted least square:

-0.0196189562841


Ordinary least square:

-0.00161179000589


Probabilities that GCOS criteria is met:

Weighted least square:

3.0 %

Ordinary least square:

5.5 %


DHR statistics

Temporal stability [1/decade]:


abs

rel


Weighted least square:

-0.020180114819


Ordinary least square:

-0.00947808397665


Probabilities that GCOS criteria is met:

Weighted least square:

3.1 %

Ordinary least square:

4.2 %


+057/+063 deg (BHR)


BHR statistics

Temporal stability [1/decade]:


abs

rel


Weighted least square:

0.00551697219692


Ordinary least square:

-0.0145149365704


Probabilities that GCOS criteria is met:

Weighted least square:

0.1 %

Ordinary least square:

4.6 %


DHR statistics

Temporal stability [1/decade]:


abs

rel


Weighted least square:

0.0144525876389


Ordinary least square:

-0.0187913426462


Probabilities that GCOS criteria is met:

Weighted least square:

0.0 %

Ordinary least square:

4.5 %


Temporal anomaly analyis

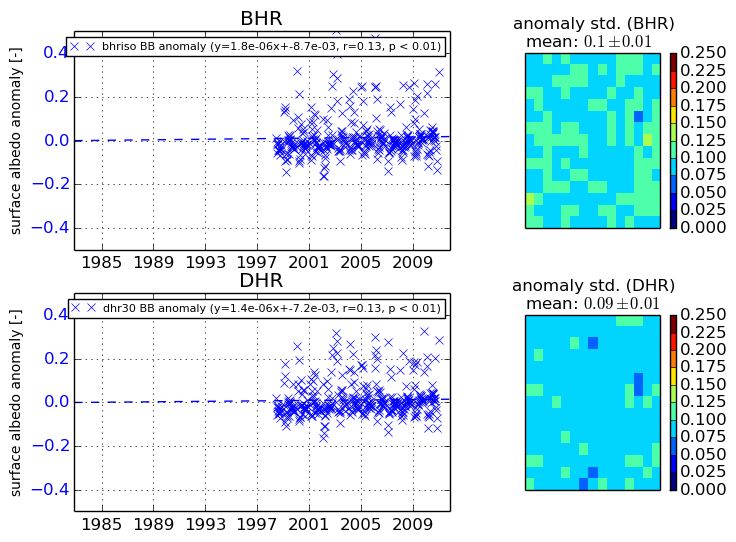
The variance of the temporal anomalies provides an additional measure about the stability of the signal AFTER removal of the mean seasonal cylce.
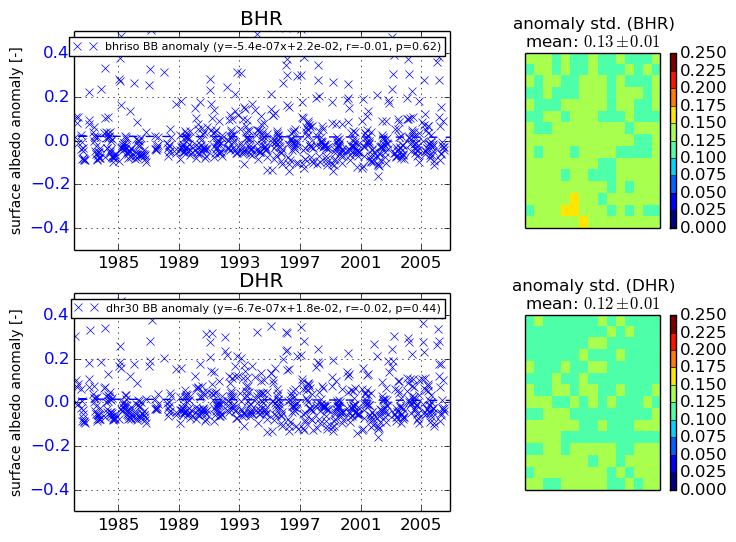
+000 deg


+057/+063 deg