SON_LA


Location

lon / lat [deg]: 103.9053 / 21.3321

Source network: AERONET


Geostationary surface albedo (GSA) data


“+000”


“+057/+063”


Landcover information (based on ESA CCI landcover data)


Landcover fractions @ 2km distance


Landcover fractions @ 20 km distance


Legend


Distance to open water bodies [km]:

19.91

Distance to urban areas [km]:

2.19


Radius: 1 km

Number of landcover classes:

3

Dominant landcover type:

10: cropland, rainfed

Fraction of dominant landcover type [%]:

67.0


Radius: 2 km

Number of landcover classes:

6

Dominant landcover type:

10: cropland, rainfed

Fraction of dominant landcover type [%]:

30.0


Radius: 5 km

Number of landcover classes:

8

Dominant landcover type:

40: mosaic natural vegetation (tree, shrub, herbaceous cover) (>50%) / cropland (<50%)

Fraction of dominant landcover type [%]:

28.0


Radius: 10 km

Number of landcover classes:

8

Dominant landcover type:

40: mosaic natural vegetation (tree, shrub, herbaceous cover) (>50%) / cropland (<50%)

Fraction of dominant landcover type [%]:

24.0


Radius: 20 km

Number of landcover classes:

8

Dominant landcover type:

30: mosaic cropland (>50%), natural veg. (< 50%)

Fraction of dominant landcover type [%]:

22.0


Disturbances


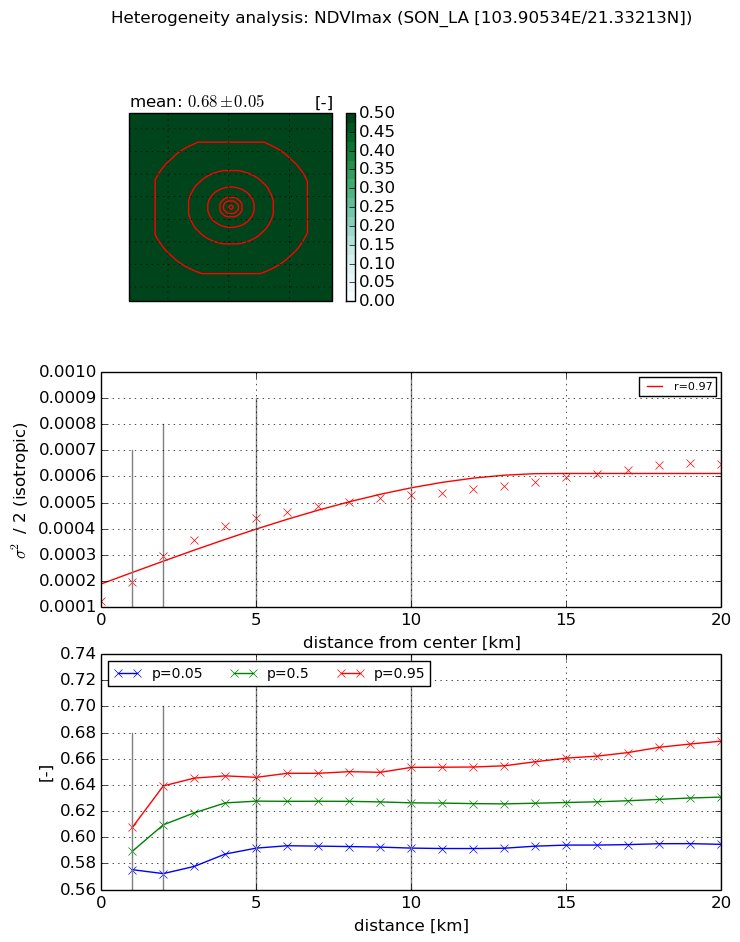
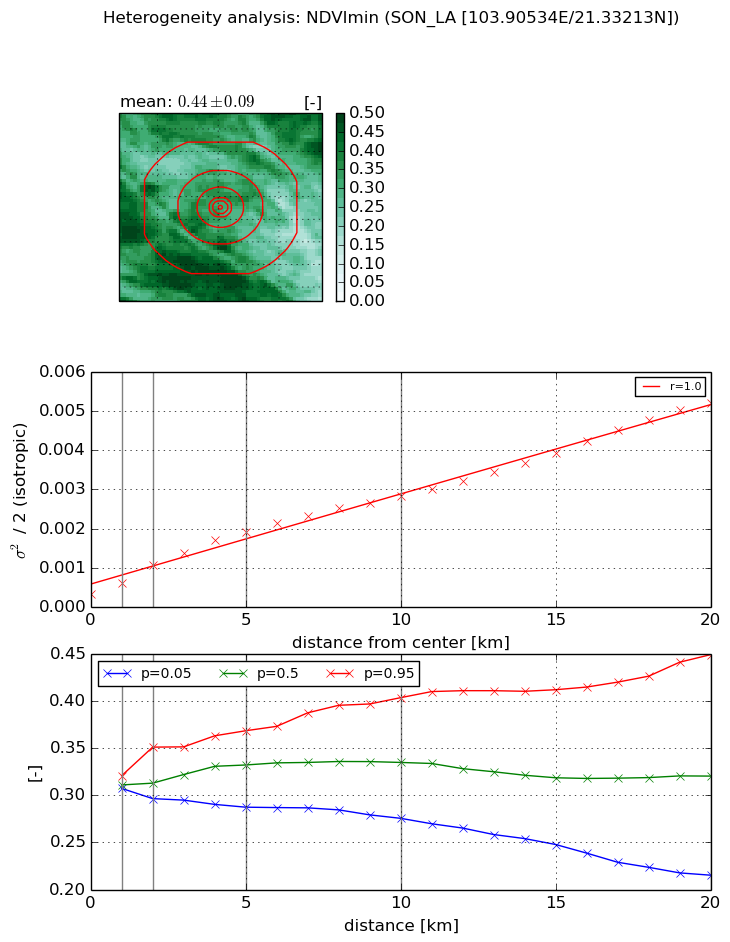
Heterogeneity analysis

The heterogeneity analysis provides information about the spatial and temporal heterogeneity of the site.

Topography


Roman et al. (2009) index


St

8.79718773406

Rcv

0.00607742299753

Rse

0.0

Rst

-0.168773701936

Rsv

-0.166166947056


Height range @ 1km [m]

186

Height range @ 2km [m]

204

Height range @ 5km [m]

245

Height range @ 10km [m]

-999

Height range @ 20km [m]

-999


Variance slope @ 1 km

4054

Variance slope @ 2 km

2134

Variance slope @ 5 km

979

Variance slope @ 10 km

-999

Variance slope @ 20 km

-999


NDVI (max. NDVI composite)


Roman et al. (2009) index


St

5.86164826828

Rcv

-0.197504396381

Rse

0.0

Rst

-0.138051102977

Rsv

0.176245936466


NDVI range @ 1km [-]

0.03

NDVI range @ 2km [-]

0.07

NDVI range @ 5km [-]

0.05

NDVI range @ 10km [-]

0.06

NDVI range @ 20km [-]

0.08


Variance slope @ 1 km

7.13360262748e-05

Variance slope @ 2 km

8.56817615686e-05

Variance slope @ 5 km

6.54041014796e-05

Variance slope @ 10 km

3.86526509749e-05

Variance slope @ 20 km

2.1791753195e-05


NDVI (min. NDVI composite)I


Roman et al. (2009) index


St

3.8013313097e-07

Rcv

0.329693468072

Rse

0.0

Rst

0.088787674469

Rsv

7891971.51341


NDVI range @ 1km [-]

0.01

NDVI range @ 2km [-]

0.05

NDVI range @ 5km [-]

0.08

NDVI range @ 10km [-]

0.13

NDVI range @ 20km [-]

0.23


NDVI slope @ 1 km

0.000278028944006

NDVI slope @ 2 km

0.00036465486525

NDVI slope @ 5 km

0.000329965293407

NDVI slope @ 10 km

0.000249979953887

NDVI slope @ 20 km

0.00022897387298


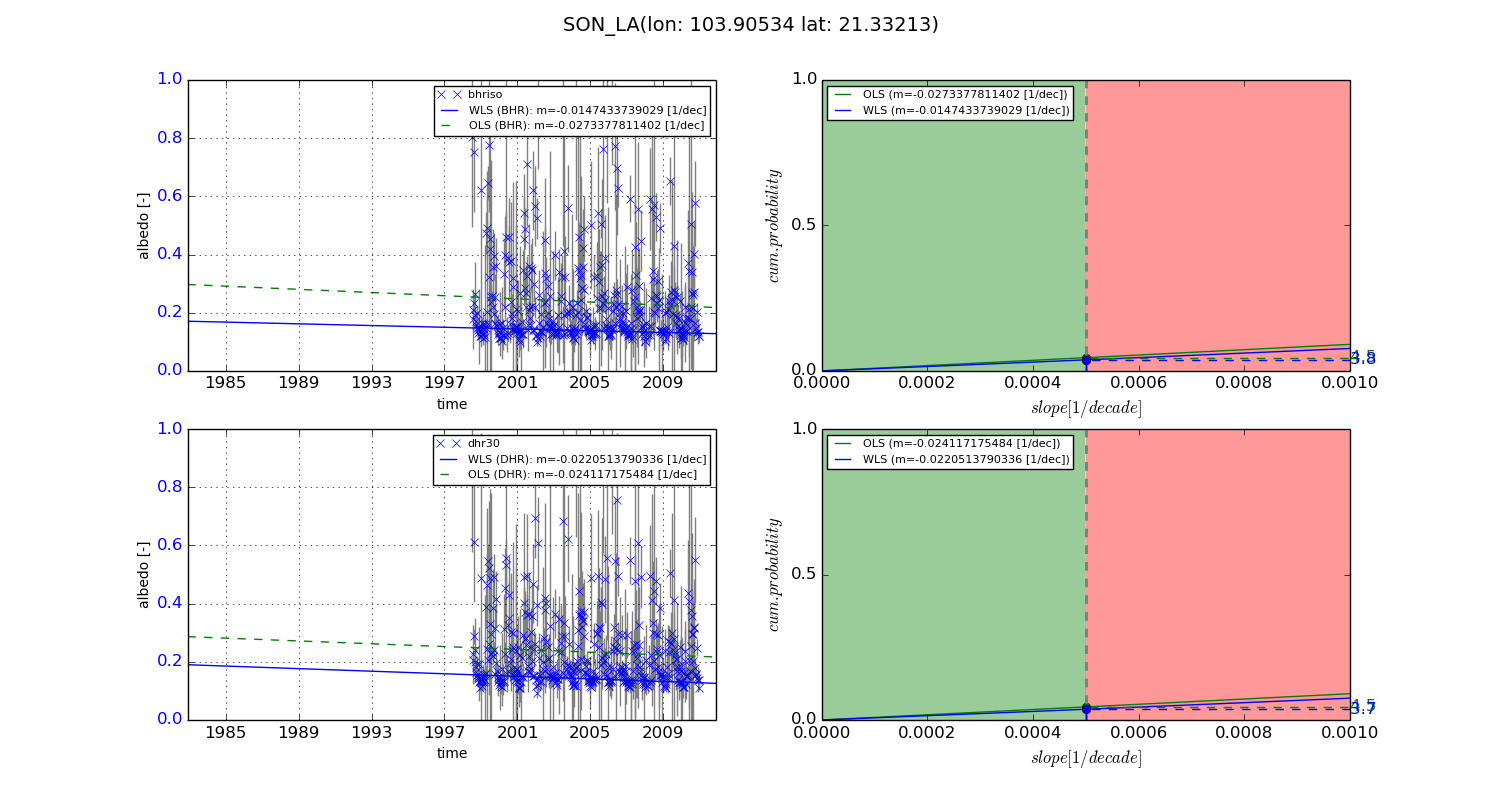
Temporal stability analysis

+000 deg (BHR)


BHR statistics

Temporal stability [1/decade]:


abs

rel


Weighted least square:

None


Ordinary least square:

None


Probabilities that GCOS criteria is met:

Weighted least square:

None %

Ordinary least square:

None %


DHR statistics

Temporal stability [1/decade]:


abs

rel


Weighted least square:

None


Ordinary least square:

None


Probabilities that GCOS criteria is met:

Weighted least square:

None %

Ordinary least square:

None %


+057/+063 deg (BHR)


BHR statistics

Temporal stability [1/decade]:


abs

rel


Weighted least square:

-0.0147433739029


Ordinary least square:

-0.0273377811402


Probabilities that GCOS criteria is met:

Weighted least square:

3.8 %

Ordinary least square:

4.5 %


DHR statistics

Temporal stability [1/decade]:


abs

rel


Weighted least square:

-0.0220513790336


Ordinary least square:

-0.024117175484


Probabilities that GCOS criteria is met:

Weighted least square:

3.7 %

Ordinary least square:

4.5 %


Temporal anomaly analyis

The variance of the temporal anomalies provides an additional measure about the stability of the signal AFTER removal of the mean seasonal cylce.

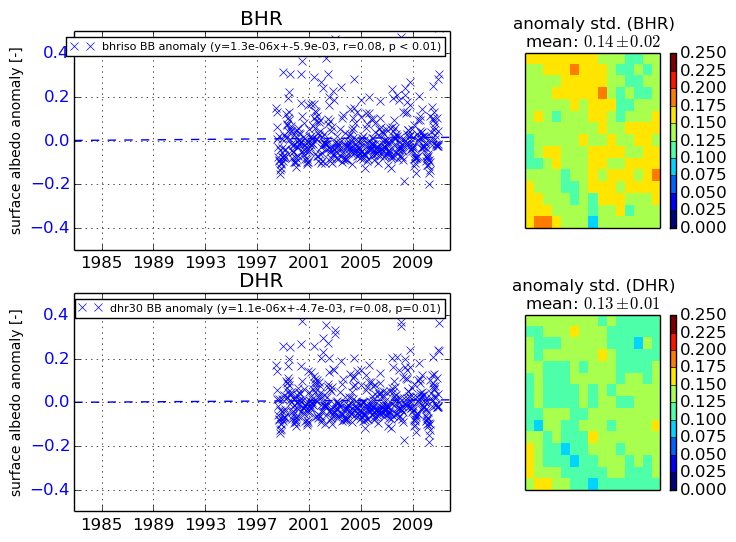
+000 deg


+057/+063 deg