SON


Location

lon / lat [deg]: 12.9577 / 47.054

Source network: BSRN


Geostationary surface albedo (GSA) data


“+000”


“+057/+063”


Landcover information (based on ESA CCI landcover data)


Landcover fractions @ 2km distance


Landcover fractions @ 20 km distance


Legend


Distance to open water bodies [km]:

1.22

Distance to urban areas [km]:

8.49


Radius: 1 km

Number of landcover classes:

3

Dominant landcover type:

220: permanent snow and ice

Fraction of dominant landcover type [%]:

54.0


Radius: 2 km

Number of landcover classes:

6

Dominant landcover type:

200: bare areas

Fraction of dominant landcover type [%]:

41.0


Radius: 5 km

Number of landcover classes:

7

Dominant landcover type:

200: bare areas

Fraction of dominant landcover type [%]:

31.0


Radius: 10 km

Number of landcover classes:

9

Dominant landcover type:

130: grassland

Fraction of dominant landcover type [%]:

33.0


Radius: 20 km

Number of landcover classes:

11

Dominant landcover type:

70: Tree cover, needleleaved, evergreen, closed to open (>15%)

Fraction of dominant landcover type [%]:

30.0


Disturbances


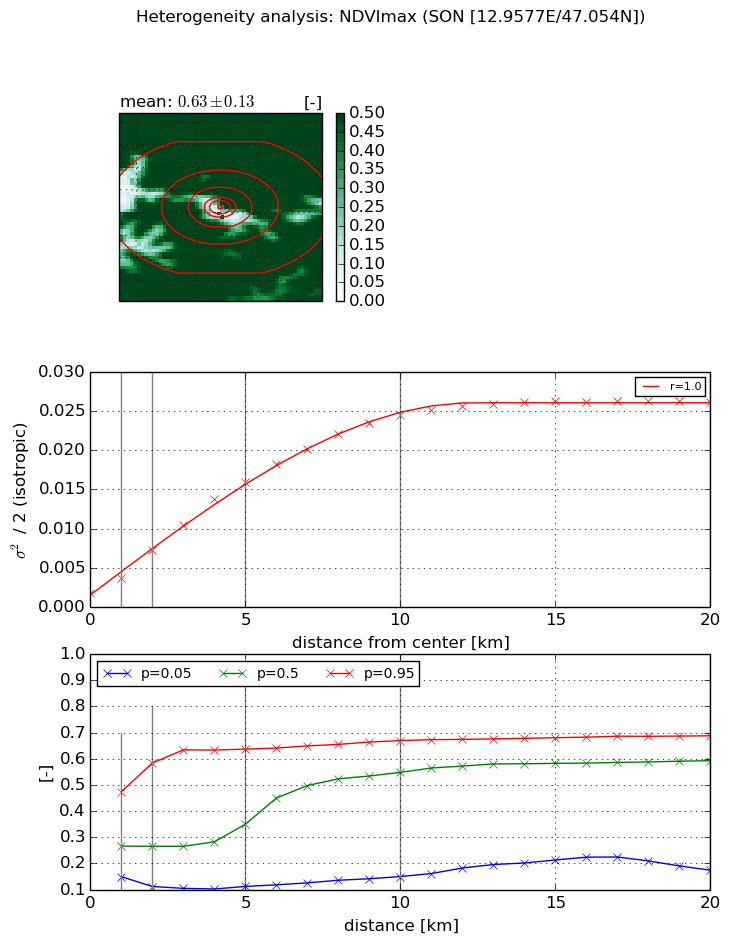
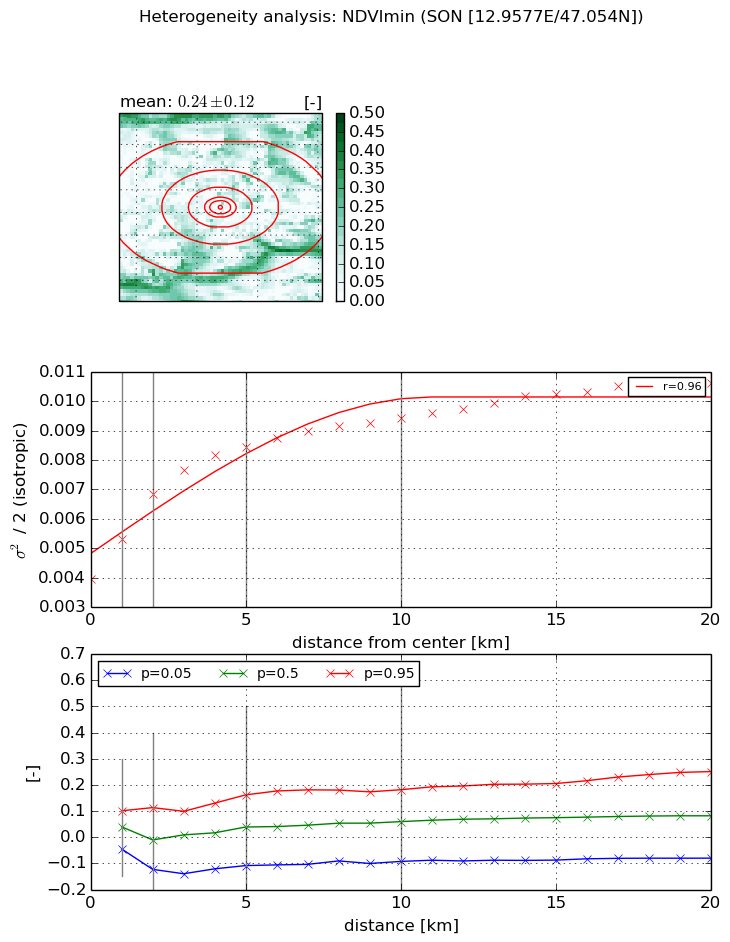
Heterogeneity analysis

The heterogeneity analysis provides information about the spatial and temporal heterogeneity of the site.

Topography


Roman et al. (2009) index


St

27.3300033915

Rcv

0.0788438872252

Rse

0.0

Rst

-0.00433005859888

Rsv

0.0265955246378


Height range @ 1km [m]

686

Height range @ 2km [m]

960

Height range @ 5km [m]

1261

Height range @ 10km [m]

-999

Height range @ 20km [m]

-999


Variance slope @ 1 km

43716

Variance slope @ 2 km

47018

Variance slope @ 5 km

37585

Variance slope @ 10 km

-999

Variance slope @ 20 km

-999


NDVI (max. NDVI composite)


Roman et al. (2009) index


St

7.05858165296

Rcv

-0.170603606099

Rse

0.0

Rst

-0.0519624905571

Rsv

-0.202448466821


NDVI range @ 1km [-]

0.33

NDVI range @ 2km [-]

0.47

NDVI range @ 5km [-]

0.53

NDVI range @ 10km [-]

0.52

NDVI range @ 20km [-]

0.51


Variance slope @ 1 km

0.00192054238642

Variance slope @ 2 km

0.00271978119459

Variance slope @ 5 km

0.00296903461323

Variance slope @ 10 km

0.00236536192434

Variance slope @ 20 km

0.00115840799677


NDVI (min. NDVI composite)I


Roman et al. (2009) index


St

nan

Rcv

nan

Rse

nan

Rst

nan

Rsv

nan


NDVI range @ 1km [-]

0.15

NDVI range @ 2km [-]

0.24

NDVI range @ 5km [-]

0.27

NDVI range @ 10km [-]

0.27

NDVI range @ 20km [-]

0.33


NDVI slope @ 1 km

0.00137086489292

NDVI slope @ 2 km

0.0014483903593

NDVI slope @ 5 km

0.000908421363693

NDVI slope @ 10 km

0.000484976621468

NDVI slope @ 20 km

0.000256497240988


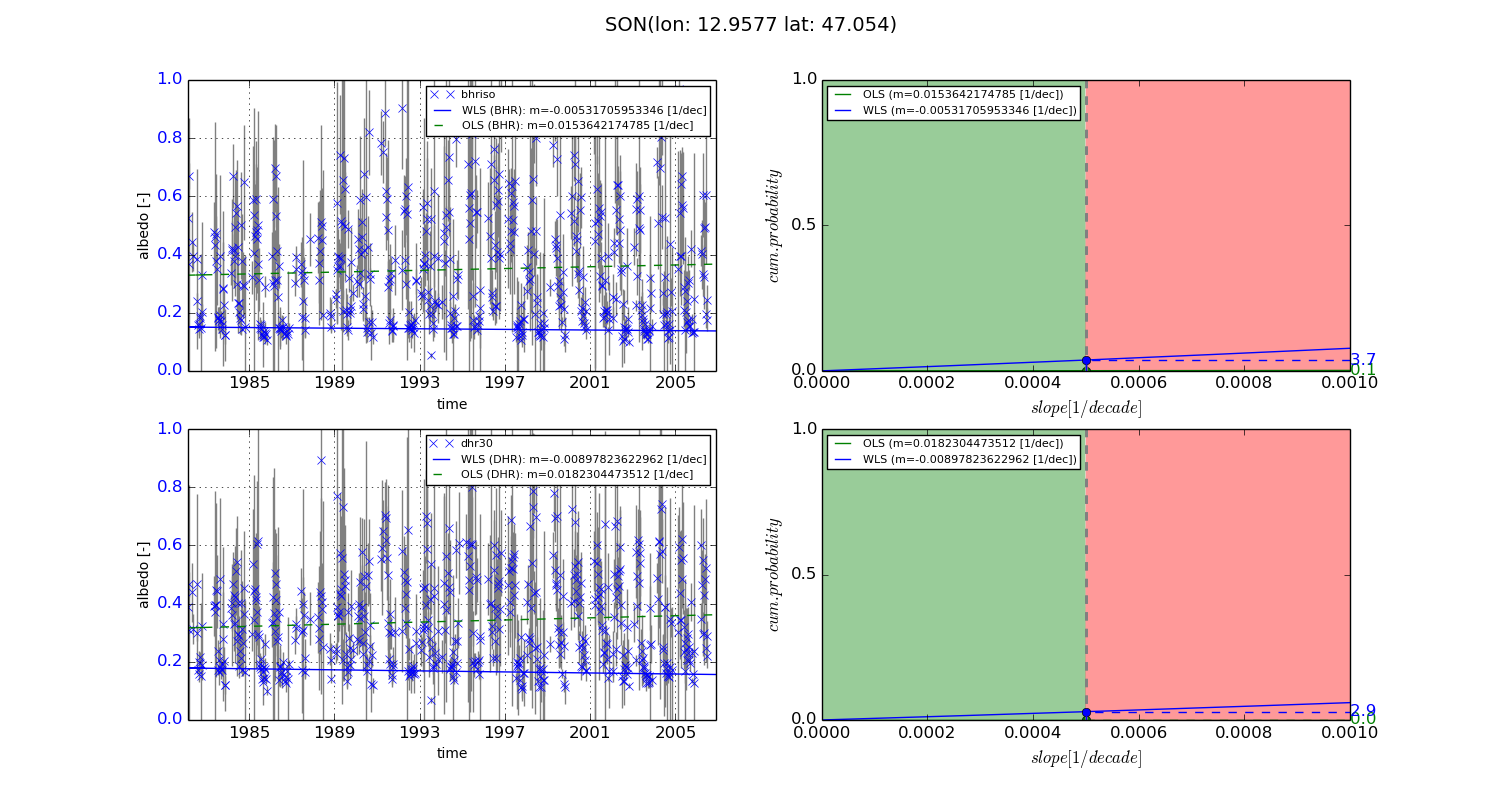
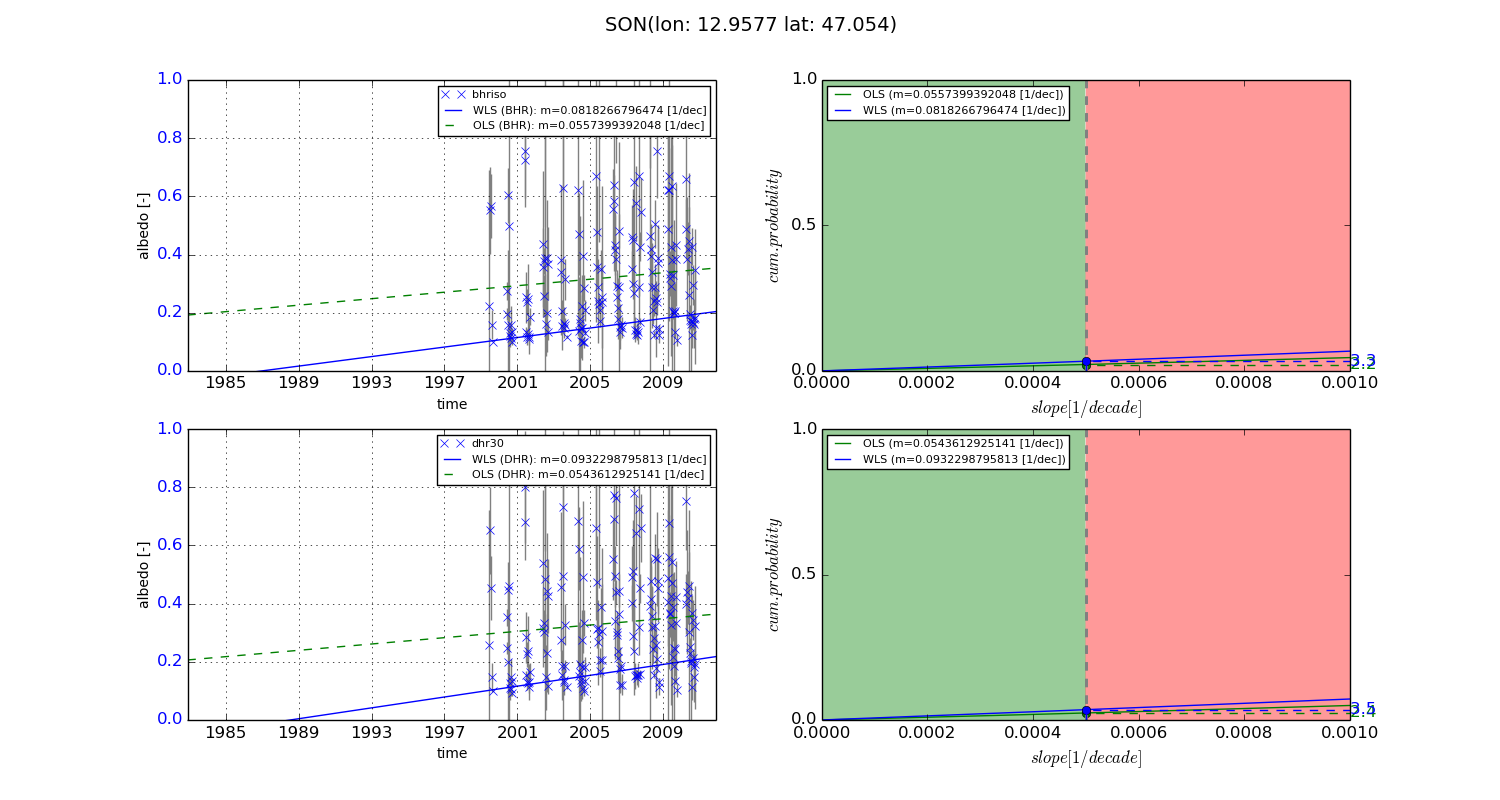
Temporal stability analysis

+000 deg (BHR)


BHR statistics

Temporal stability [1/decade]:


abs

rel


Weighted least square:

-0.00531705953346


Ordinary least square:

0.0153642174785


Probabilities that GCOS criteria is met:

Weighted least square:

3.7 %

Ordinary least square:

0.1 %


DHR statistics

Temporal stability [1/decade]:


abs

rel


Weighted least square:

-0.00897823622962


Ordinary least square:

0.0182304473512


Probabilities that GCOS criteria is met:

Weighted least square:

2.9 %

Ordinary least square:

0.0 %


+057/+063 deg (BHR)


BHR statistics

Temporal stability [1/decade]:


abs

rel


Weighted least square:

0.0818266796474


Ordinary least square:

0.0557399392048


Probabilities that GCOS criteria is met:

Weighted least square:

3.3 %

Ordinary least square:

2.2 %


DHR statistics

Temporal stability [1/decade]:


abs

rel


Weighted least square:

0.0932298795813


Ordinary least square:

0.0543612925141


Probabilities that GCOS criteria is met:

Weighted least square:

3.5 %

Ordinary least square:

2.4 %


Temporal anomaly analyis

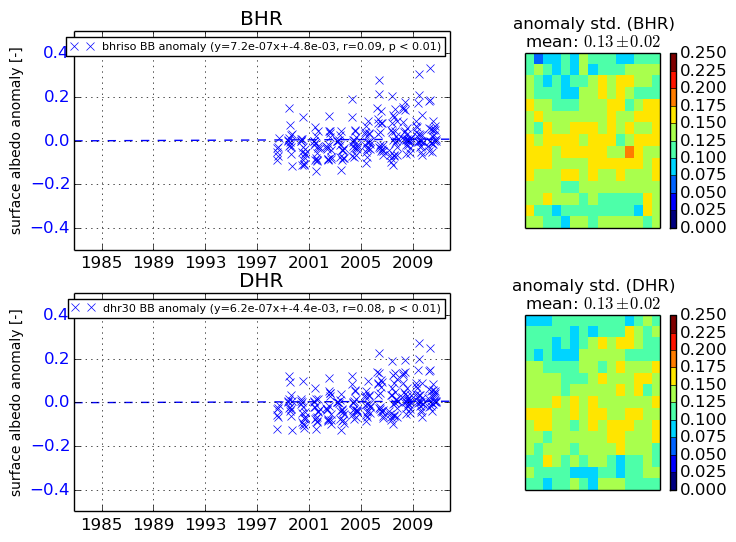
The variance of the temporal anomalies provides an additional measure about the stability of the signal AFTER removal of the mean seasonal cylce.
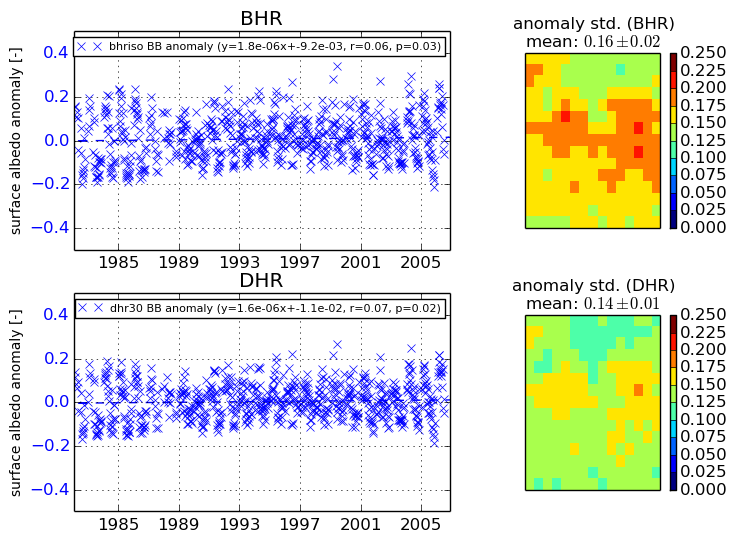
+000 deg


+057/+063 deg